
Detecting Hidden Privilege with Machine Learning: Anomaly Detection in BeyondTrust’s True Privilege Graph


Detecting Hidden Privilege with Machine Learning: Anomaly Detection in BeyondTrust’s True Privilege Graph
Hidden privilege paths are one of the most dangerous blind spots in identity security. In this Phantom Labs research blog, we explore how statistical modeling and machine learning applied to the BeyondTrust True Privilege™ Graph can detect anomalous privilege paths and unexpected access relationships across complex environments.
Mapping Hidden Privilege Paths with the True Privilege™ Graph and Machine Learning
Hidden privilege exists across every organization, with the most visible, direct assignments only representing a small fraction of how privilege flows through an environment. Instead, privilege often involves complex nesting relationships and cross-domain access.
This complexity leads to gaps in an organization’s understanding of privilege across its own infrastructure. When left unaddressed, these gaps become unintended identity attack paths—blind spots that threat actors can and will weaponize.
The True Privilege Graph, which is a feature in BeyondTrust Identity Security Insights®, maps these complex and hidden Paths to Privilege™, giving security teams the visibility necessary to close security gaps before they can be exploited.
When privilege is mapped as a graph, the scope of previously hidden access relationships is uncovered. This increased volume of connections and the unique graph structure of these relationships require advanced models to separate unusual or concerning paths from common ones. While rules-based detections remain essential for flagging known bad behaviors, they are fundamentally reactive and limited to only detecting anticipated threats.
How Does Machine Learning Help Identify Graph Anomalies?
Statistical and machine learning techniques are critical for identifying graph anomalies because they can detect unexpected behavior without relying on strict rules. This enables the discovery of risky behaviors that haven’t been flagged before.
By learning an organization’s “normal” graph structure, statistical models can surface edges, paths, and nodes that deviate from the expected baseline, potentially revealing hidden privilege relationships or emerging identity attack paths.
This blog explores the application of statistical and machine learning (ML) techniques on a privilege graph to detect unusual access. We will explore our key findings and challenges, focusing on two types of graph anomalies: anomalous paths and anomalous destination nodes.
What is a Graph Anomaly?
A graph anomaly is an edge, node, path, or subgraph within the BeyondTrust True Privilege Graph that is exceptionally rare, indicating an unexpected pattern of access. Such deviations indicate possible misconfiguration or abuse, including rare Paths to Privilege, unintended lateral movement opportunities, and access to resources outside a user’s historical norm.
Identity Security and the Privilege Graph: Nodes, Edges, and Paths
Modern identity security requires mapping privilege as a graph to reveal the scope of previously hidden relationships and access paths. Modern directory structures like Entra ID contain complex access relationships requiring advanced visibility. Before exploring modeling and analysis, we must first clarify essential terminology:
Source Node: The identity or principal from which privilege relationships originate. It’s the starting point in a privilege path that connects it to downstream resources, roles, or other identities across the environment.
Destination Node: The endpoint of a privilege path. The resources, roles, or other entitlements (e.g., group memberships, apps, permissions) that an identity can reach through its assigned or inherited privileges.
Edge: A direct connection between two nodes
Path: A series of edges between a source node and destination node.
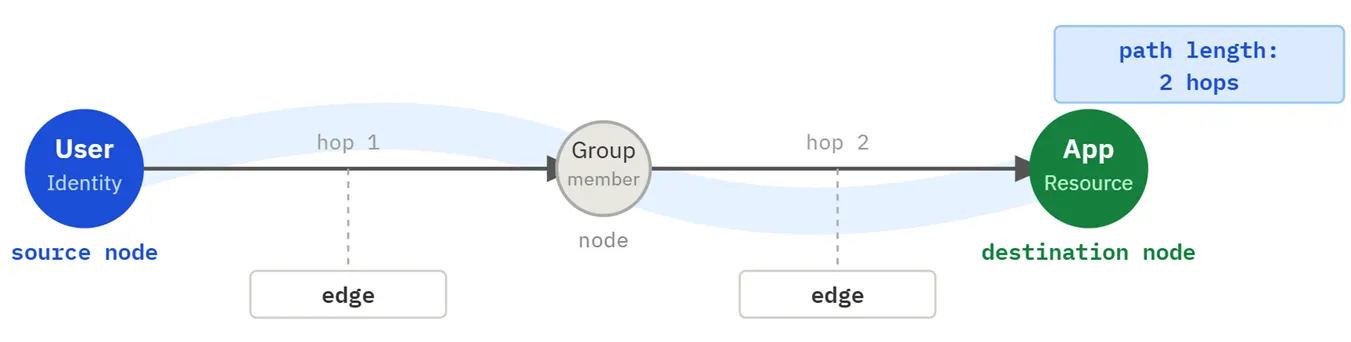
Path Length: The number of “hops” from source to destination (e.g., the three-node path A->B->C has two hops)
For clarity, Figure 1 displays an example of a simple two-hop path where the source node is a user with group membership that allows access to an application.
Statistical Modeling of Anomalous Paths in the Privilege Graph
Statistical and machine learning models help security teams investigate unusual paths for a given source or destination node, identifying anomalous routes representing unknown privilege escalation paths or identity attack paths arising from misconfiguration or malicious activity.
Teams use various methods to identify anomalous paths. A straightforward approach is to use the observed frequencies of each path, conditional on the destination node. Figure 2 shows an example of this approach on an actual organization using BeyondTrust Identity Security Insights. It displays the observed frequencies for each path where the destination node is an Azure Directory Role.
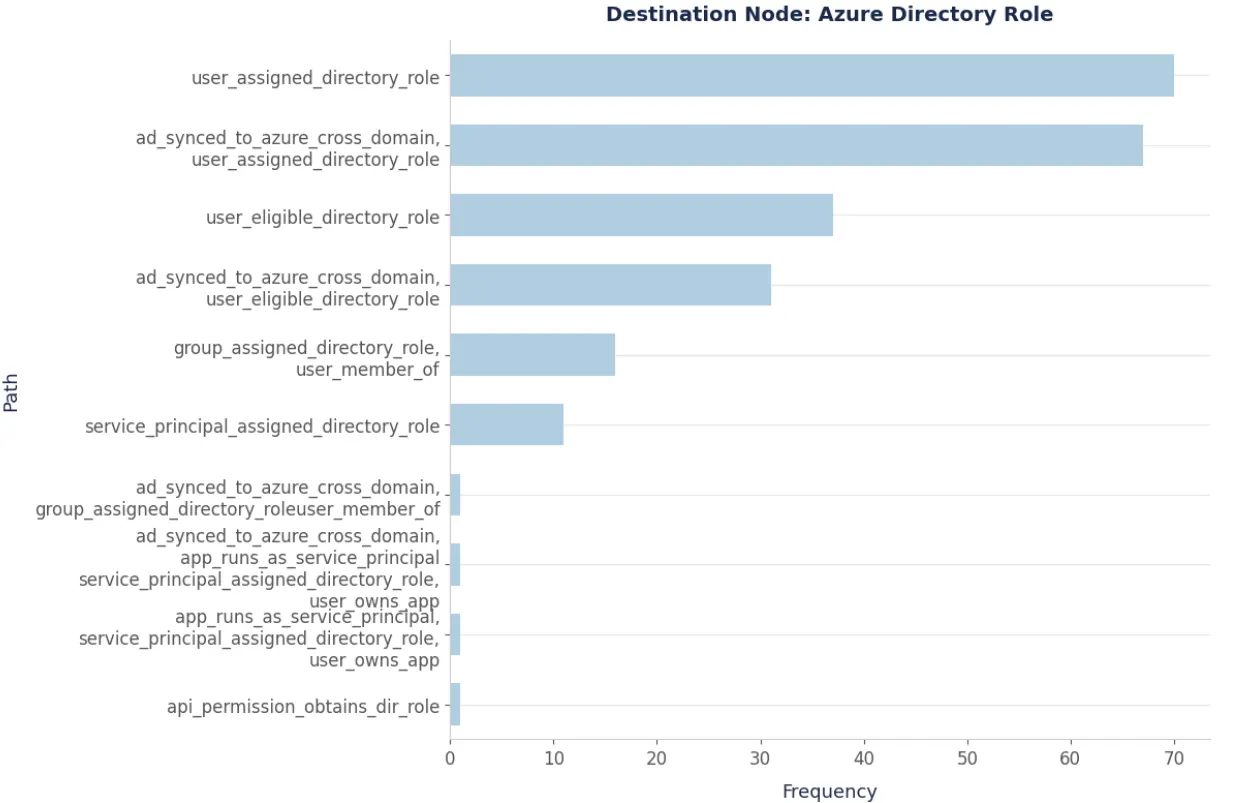
Of the 236 paths to an Azure Directory Role, the large majority are relatively direct paths, consisting of one or two hops. In these paths, the user was directly assigned the role, has assignment through group membership, is eligible for the role through Entra PIM, or has a path to the role through Microsoft Entra Connect Sync. However, there are four paths here that seem particularly interesting as they only have a single occurrence.
Alternatively, for the same underlying data, we can model the number of steps between the source and destination nodes. Figure 3 displays the distribution of path lengths. Though the pair of three-hop paths might be concerning, we will focus on the single four-hop path.
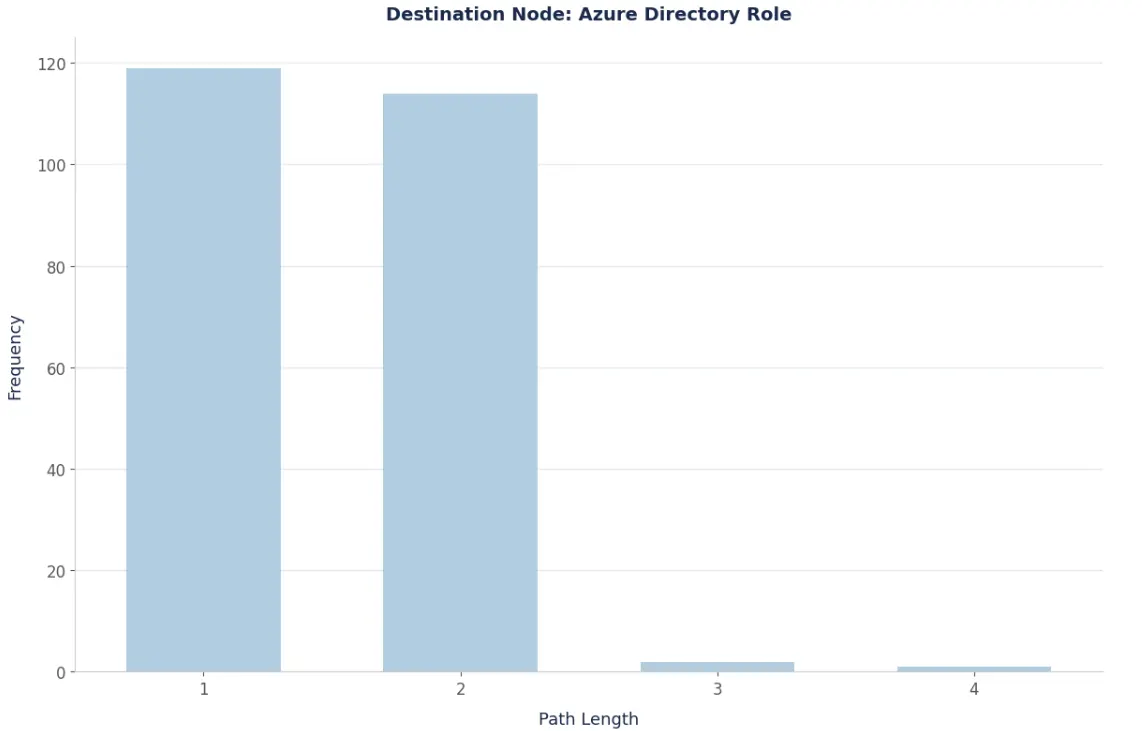
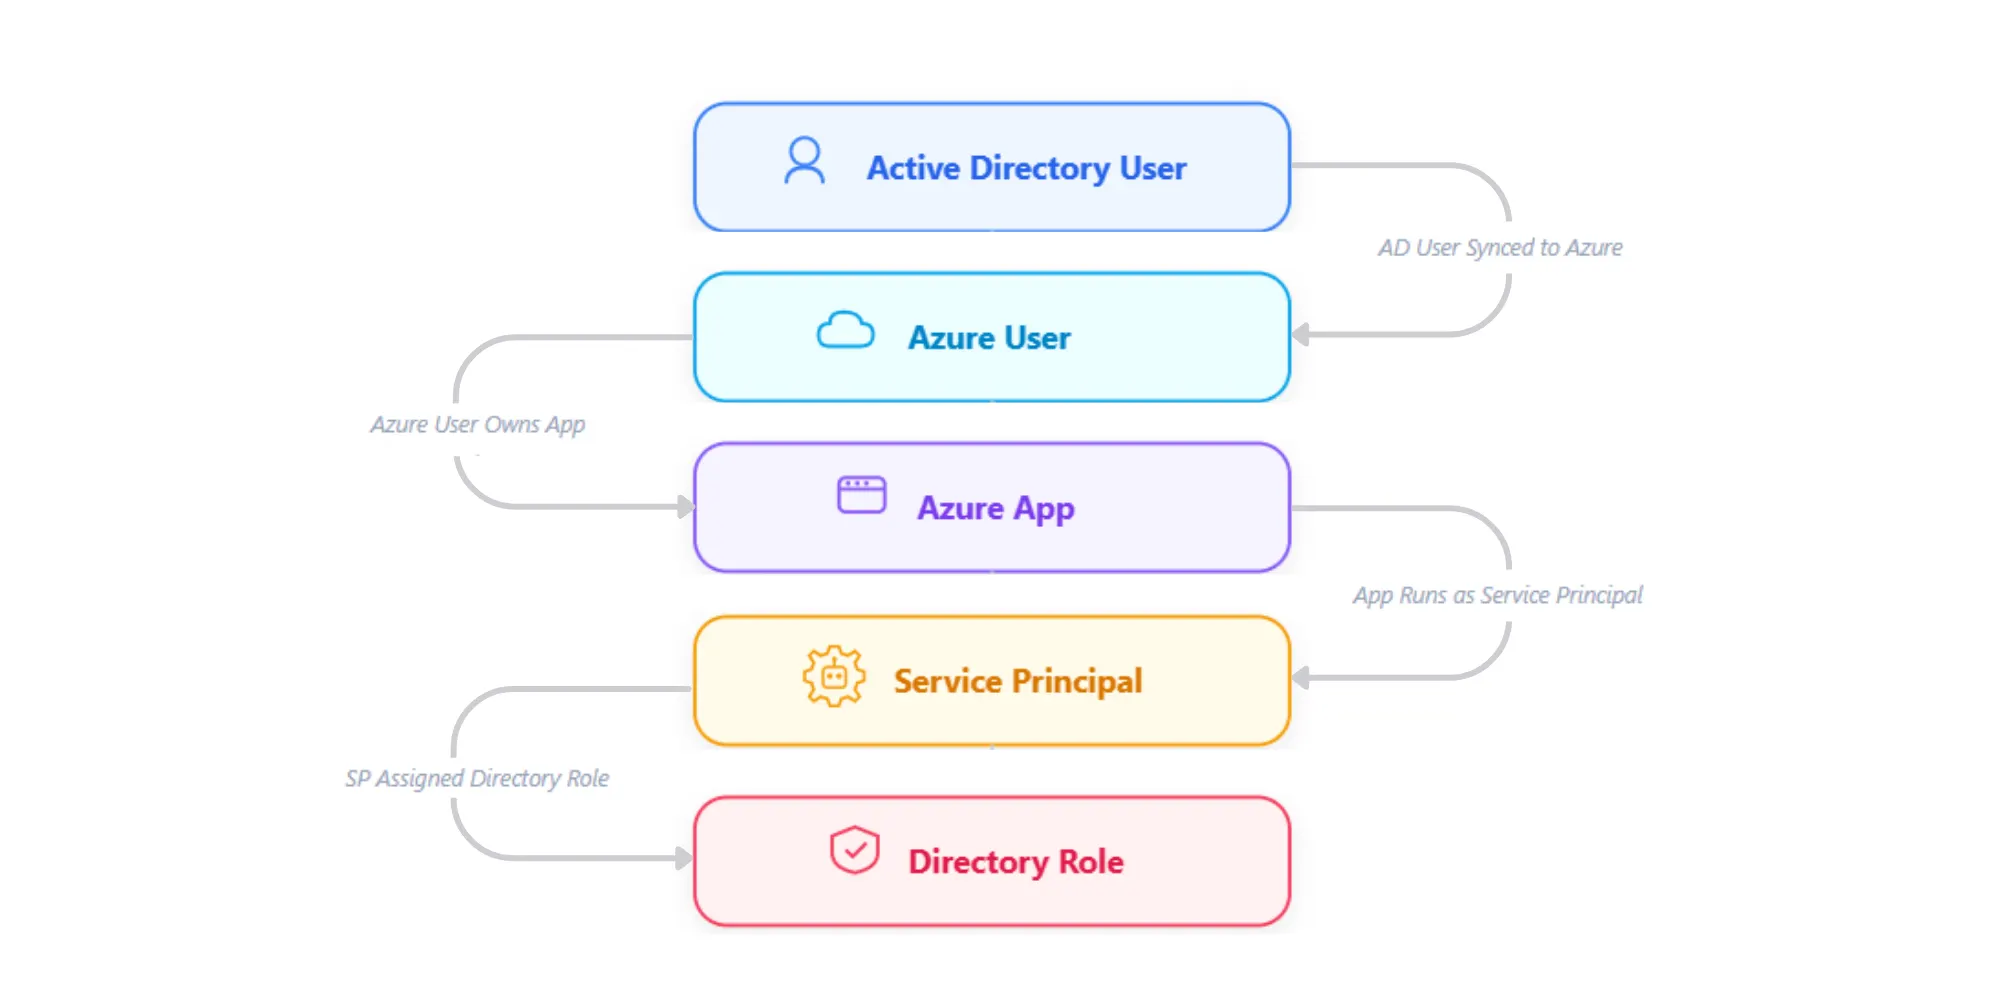
In the four-hop case, we have a path that is indirect compared to the usual one- to two-hop paths. It involves (1) an Active Directory user (2) synced to Entra ID (3) that has ownership permissions over an Entra ID application (4) with a path to a privileged directory role. This is more obvious when viewed as a graph, as shown in Figure 4.
To summarize, the model finds this path unusual for two reasons. One is its low observed probability (0.004), occurring in only 1/236 paths to an Azure Directory Role. The second reason is its path length, which is 2.64 times greater than the mean path length.
Contrary to our expectations, our analysis found that very long paths are not necessarily anomalous. For instance, several nine-hop paths from users to secrets were not flagged as anomalies. Because the nine-hop paths were much longer than the typical two to three-hop paths, our initial instinct was to override the model. However, the data showed that conditional on the destination node, nine-hop paths were actually common. This can be seen in Figure 5 where we observe a number of paths having seven, eight, and nine hops.
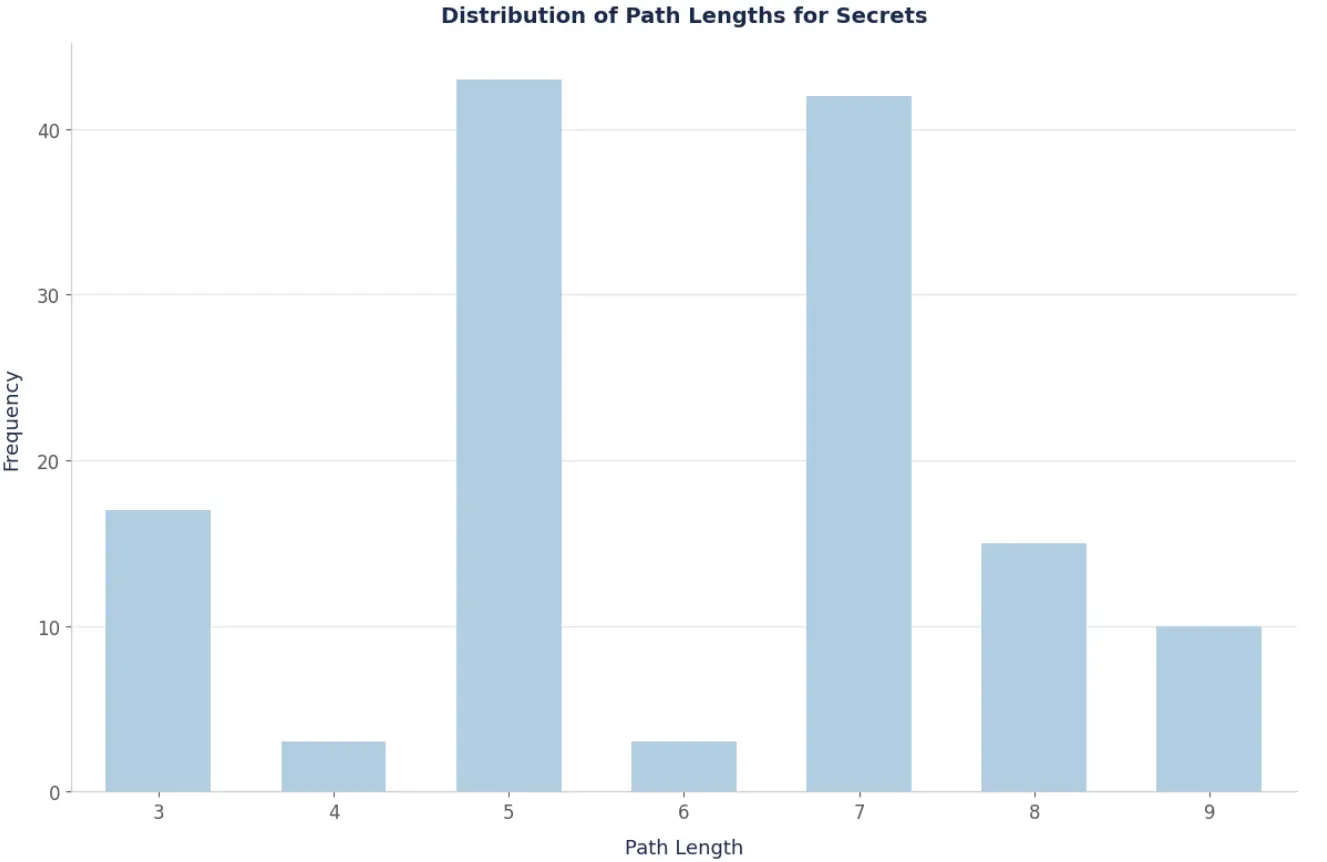
To make this clear, nine-hop paths are very rare when all destination nodes are modeled together, but common when we compare only within the same destination node. This finding was validated after consulting with our security researchers who verified that nine-hop paths are expected, given the limited number of ways paths to secrets can occur. Additionally, as the privilege graph is developed further, the number of long paths will continue to grow—resulting in an even greater need for models capable of distinguishing long paths that are truly rare, from those that are common.
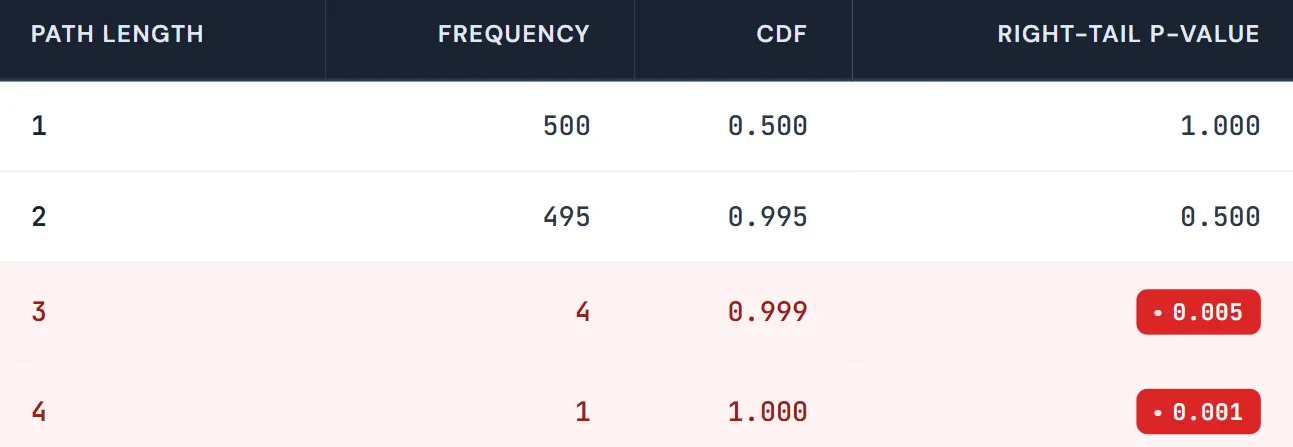
Path length can be modeled in a number of ways. A cumulative distribution or right-tail p-value approach could be used to identify extreme values. Table 1 shows a simple example where paths of three to four hops can be considered anomalous due to low probability of seeing those lengths or greater, as indicated by right-tail p-values of 0.005 and 0.001.
Path length could also be compared to a particular quantile of the associated distribution. For instance, all paths where Observed Path Length / Quantile (Path Length, 0.9) > = 2 could be deemed anomalous. This effectively filters anomalies to only those paths that are at least twice as large as the 0.9 quantile (the path length value that is greater than 90% of path lengths). For the secrets case with distribution given in Figure 5, the nine-hop paths are scored as 9/8 = 1.125, failing to meet the minimum threshold of two to be considered anomalous. Additionally, we note that in the case of distributions where only a small number of distinct path lengths have occurred, larger quantiles may not be well-defined. Under this scenario it may make more sense to use a smaller quantile, sample average, or the p-value approach mentioned earlier.
A regression approach could also be utilized, allowing for the inclusion of covariates such as account type or source node domain type. Anomalies under this approach would be those paths with large deviations between observed and predicted path lengths. An encoding of destination node into a series of indicator variables or a hierarchical model would be useful methods for avoiding the estimation of many separate models, an issue with the stratified modeling approach mentioned earlier.
Given the discrete nature of path length, the natural choices for probability distribution consist of the Poisson (with a variable dispersion parameter) and negative binomial. However, in our analysis, there were numerous instances where path length was nearly binary or limited to a small number of distinct values, making the binomial distribution more appropriate.
Identifying Anomalous Destination Nodes: Unusual Access to Privileged Resources
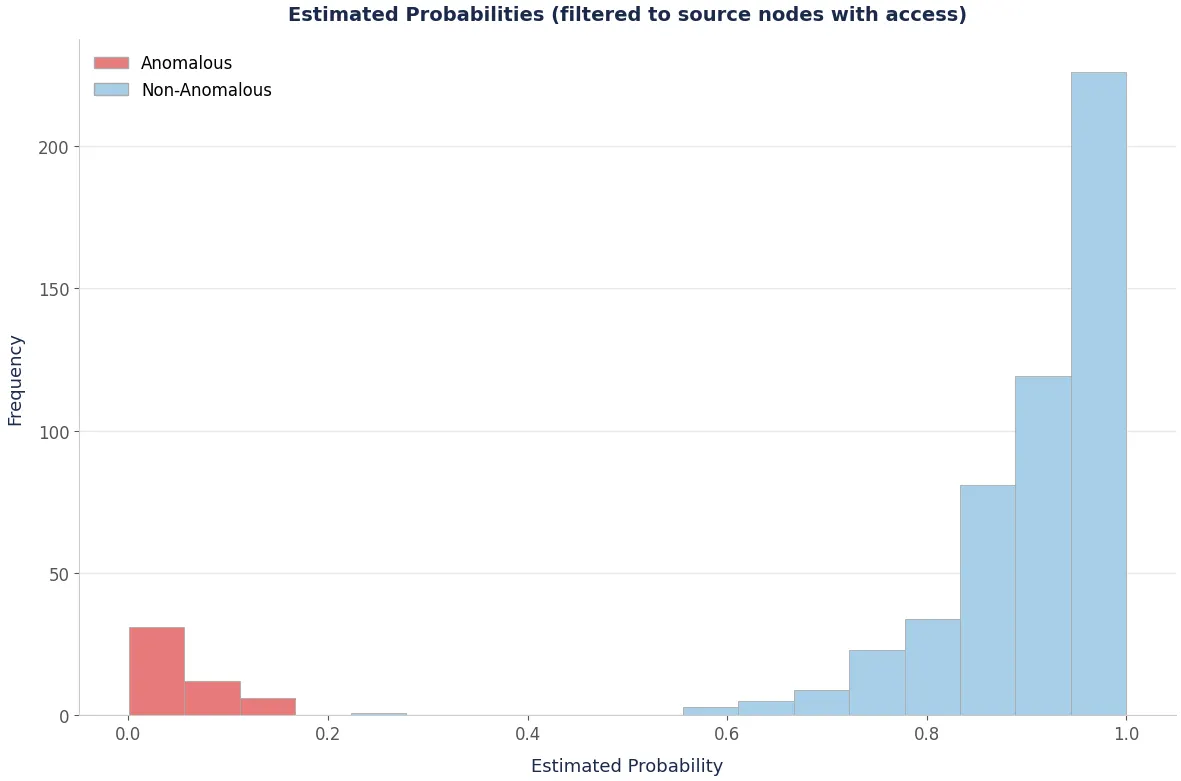
A separate statistical modeling effort focuses on anomalous destination nodes to monitor unusual access to privileged resources. Machine learning models flag these anomalies to reveal misconfigurations, unusual access relationships, or early indicators relevant to privilege escalation detection. This modeling effort was performed separately for each destination node. Source nodes with anomalous access were then identified as those failing to meet a minimum predicted probability threshold. These are cases where the model has estimated a large probability for the incorrect class, indicating that the anomaly fits more closely with the distribution of source nodes without access.
This type of anomaly is visualized in Figure 6, where the cases with access—but estimated probabilities under a 0.2 threshold—are categorized as anomalous.
Initial modeling efforts focused on modeling unexpected access to a destination node given a source node’s entire privilege configuration. Several of the accounts flagged under this approach as having unusual privilege configurations corresponded with IT administrator and software engineering roles. This makes sense, but is not particularly interesting from a security standpoint. It suggested that a model including covariates representing account-specific features might be effective in separating users in IT-related roles from those in non-IT roles.
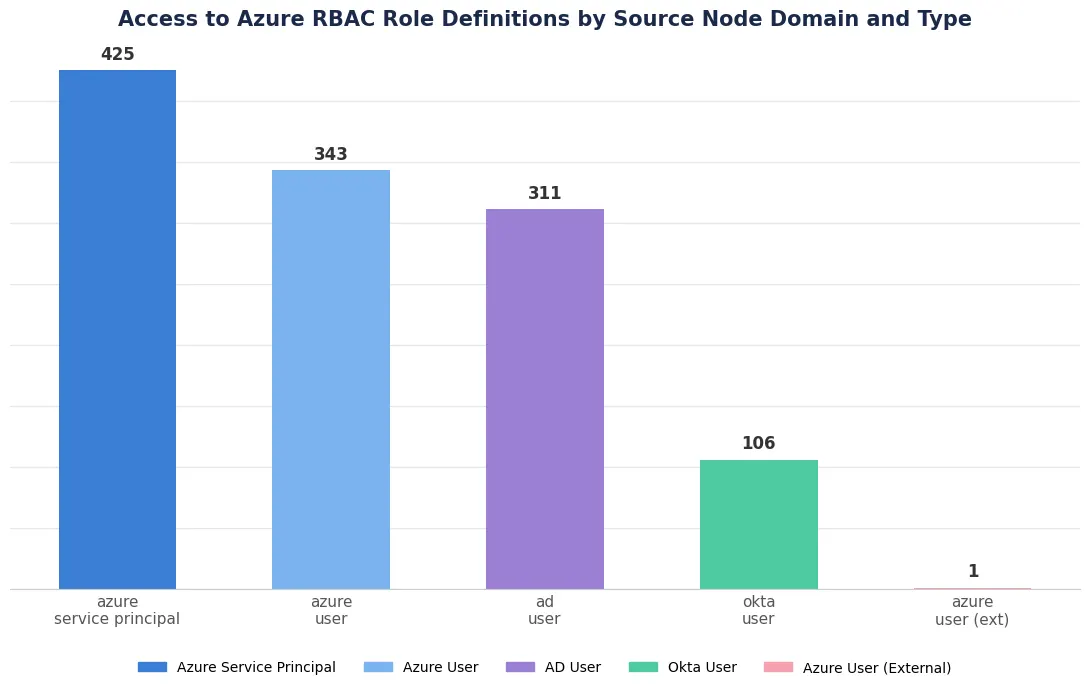
The updated model with account-specific covariates found a number of external accounts, such as Entra ID Guest accounts, with access to Azure secrets and Azure RBAC role definitions. This is visualized in Figure 7 for the Azure RBAC case, where the model has identified a single external Entra ID guest account out of over 1,000 accounts with access to Azure RBAC role definitions.
We encountered several challenges during this analysis, particularly due to problems stemming from limited data. Difficulties with model convergence were common due to small strata causing separation-related issues. Regularized models, utilizing penalized log-likelihoods, were used to resolve issues with model convergence. Limited data also constrained the possible complexity of models, making interactions and inclusion of nonlinear terms difficult. In the most extreme cases, certain destination nodes were so rare that modeling with any covariates was problematic.
Simple workarounds in this setting might be to group together multiple categories with insufficient data, or to label all occurrences as anomalies. More sophisticated approaches that were not explored here, though worth considering, include Firth’s method for rare events and Bayesian models using informative priors to account for limited data.
Required minimum thresholds on model performance were set, as certain response variables could not be well-modeled with the data available; models that fell below this threshold were excluded. We also explored count-based models that structured the response as the number of destination nodes, rather than a binary variable. However, in certain cases, this was problematic due to many response variables having a limited number of distinct values.
Why Graph-Based Privilege Anomaly Detection Matters for Security
This research explores applying traditional modeling to graph-based data. We chose this approach deliberately; despite the perception that graph data requires niche tooling, most anomalies are rooted in node/edge frequency and correlation—the same kinds of patterns that standard statistical models handle well. By leveraging traditional models to identify these patterns, we provide a framework that is technically robust and accessible to security teams without specialized graph theory backgrounds.
A statistical approach to privilege anomaly detection is necessary to fully understand how privilege flows across an organization’s IT infrastructure. While explicit rules designed by security experts continue to remain vital, relying on these rules alone makes it difficult to identify the types of complex anomalies identified here. These models naturally complement rules-based detection, providing a comprehensive approach to privilege monitoring that helps security teams identify hidden paths and reduce the identity attack surface before unusual access patterns can be exploited.
Reveal the Hidden Paths in Your Infrastructure
Rules-based detection is only half the battle. Discover how Identity Security Insights leverages graph-based intelligence and machine learning to surface the hidden privilege paths and anomalous relationships that traditional tools miss.
Explore More Research from Phantom Labs
Phantom Labs™ researchers "think like attackers" to expose privilege escalation paths and identity attack vectors, helping defenders proactively uncover misconfigurations and detect threats in complex hybrid and cloud environments. Using advanced graph modeling, Phantom Labs researchers map attack paths to privileged access across cloud and on-premises infrastructure.
FAQs
A privilege graph maps how identities, roles, and resources connect across an organization’s infrastructure. By representing their relationships as nodes and edges, security teams can visualize hidden relationships that may create unintended escalation paths.
Privilege path anomalies are rare or unexpected access paths between identities and privileged resources. These unusual connections may indicate misconfigurations, excessive access, or potential attacker movement through the environment.
Anomaly detection in machine learning refers to identifying patterns in data that deviate from normal behavior. In identity security, anomaly detection models analyze identity relationships and privilege paths to identify unusual access patterns that may indicate attacker activity.
Privilege escalation detection identifies situations where an identity gains access to privileges beyond what was originally intended. This can occur through misconfigurations, inherited permissions, or attacker activity. Graph-based privilege analysis helps security teams detect hidden privilege escalation paths and unexpected identity attack paths across complex identity environments.
The True Privilege Graph is BeyondTrust’s identity graph model that maps all privilege relationships across identities, roles, permissions, and infrastructure. It enables security teams to uncover hidden privilege escalation paths and monitor risk across hybrid and cloud environments.
Identity attacks often exploit misconfigurations or unexpected privilege relationships. Graph-based anomaly detection surfaces these rare access paths so organizations can remediate them before attackers exploit them for lateral movement or privilege escalation.
Statistical and machine learning models detect graph anomalies by learning an organization’s normal graph structure and establishing baseline access frequencies. These models surface the edges, paths, and nodes deviating from the expected to indicate hidden privilege relationships or emerging identity attack paths.
About the Author
Darren Maynard
Darren Maynard is a Senior Data Scientist at BeyondTrust with over a decade of experience in data science and machine learning. His work has focused on solving complex problems involving large datasets and rare event detection in both industry and government. He holds a master’s degree in statistics and previously worked within the defense sector.
Phantom Labs™
BeyondTrust Phantom Labs™ believes the best way to fully understand cybersecurity threats is to work closely with our customers and partners, conducting real world research into the attacks that matter most to them. By dissecting emerging attack methods and exploitation techniques of threat actors, as well as conducting novel research, the team’s mission is to help organizations defend against identity threats.