Naming Conventions and Navigation

This section covers the Endpoint Privilege Management Reporting interface elements and how to export and link to a specific report.

Interface

The Endpoint Privilege Management Reporting interface allows you to switch between dashboards and reports and to filter data as required. Shown in the image from left to right are the navigation panel, the quick filter panel, and the dashboard and reports panel.

 From left to right are the navigation panel, the filter panel, and the dashboard and reports panel.

There is a link at the bottom of each report called permalink that creates a static link to that report with your choice of filters applied.


Navigation Panel

The side navigation panel takes you to each top-level dashboard and the reports in that dashboard. Reports that are post-fixed with All indicate the data is in tabular form.

Dashboard and Reports Panel

This is the area where dashboards and reports are displayed. A dashboard is a report with multiple charts covering a wide range of data. A report is a summary table or a page focused on a particular entity.

The graphical elements of a dashboard or report are interactive. You can click on a chart to view the data at an additional level of granularity.

Quick Filter Panel

The quick panel on the left pane displays a set of predefined filters relevant to the current dashboard or report to refine the data.

Name Description
Platform
  • Windows

    Filters by endpoints running a Windows operating system.

  • macOS

    Filters by endpoints running a Mac operating system.

Time Range

This is the time range that the actions are audited. For example, you can filter by the number of elevated actions in the last 24 hours in the Actions > Elevated report.

You can choose from:

  • 24 Hours
  • 7 Days
  • 30 Days
  • 12 Months
First Reported

This is the time range filtered by the date the application was first entered in the database. For example, you can filter on the new Windows applications by publisher that were first reported in the last 7 days in the Discovery > By Publisher report.

You can choose from:

  • 24 Hours
  • 7 Days
  • 30 Days
  • 6 Months
  • 12 Months
First Executed

This is the time range the application was first executed. For example, you can filter on the new Windows applications, by type, that were first executed in the last 30 days in the Discovery > By Type report.

You can choose from:

  • 24 Hours
  • 7 Days
  • 30 Days
  • 6 Months
  • 12 Months
Filter by Target Type

This filter allows you to filter by a type of target. For example, you can filter on the applications canceled in the time range in the Actions > Canceled report.

You can choose from:

  • All
  • Applications
  • Services
  • COM
  • Remote PowerShell
  • ActiveX
  • URL
  • Content
Filter by Action

This filter allows you to filter by a type of action. For example, you can filter on the services elevated in the time range in the Target Types > Services report.

You can choose from:

  • All
  • Elevated
  • Blocked
  • Passive
  • Sandboxed
  • Canceled
Filter by App Type

This filter allows you to filter by application type. For example, you can filter by applications that are executables used in the time range in Target Types > Applications.

You can choose from:

  • All
  • Executable
  • Control Panel Applet
  • Management Console
  • Installer Package
  • Uninstaller
  • Windows Script
  • PowerShell Script
  • Batch File
  • Registry Settings
  • Windows Store
  • Binary
  • Bundle
  • Package
  • System Preference
  • Sudo Control
  • Script
Filter by Event Category

This filter allows you to filter by the category of the event. For example, you can filter by process events only that occur in the time range in the Events > All report.

You can choose from:

  • All
  • Process
  • DLL Control
  • Content
  • URL
  • Privileged Account Protection
  • Agent Start
  • User Logon
  • Services
Elevate Method

Allows you to filter by the elevation method used. For example, in the Discovery > Requiring Elevation report, you can filter by new applications which were accessed using on-demand elevation within the time range.

You can choose from:

  • All
  • Admin account used
  • Auto-elevated
  • On-demand
Path

Allows you to filter by the path. For example, to filter on applications that were launched from the System path.

You can choose from:

  • All
  • System
  • Program Files
  • User Profiles
Source

The media source of the application. For example, was the application downloaded from the internet or is it from removable media?

You can choose from:

  • All
  • Any external source
  • Downloaded from internet
  • Removable media
Challenge / Response

Allows you to filter by challenge/response events. For example, you can filter the application that required elevation on those applications launched following a completed challenge/response message.

You can choose from:

  • All
  • Only C/R
Admin Rights

Allows you to filter by the admin rights token.

You can choose from:

  • All
  • Detected
  • Not Detected
Authorization

Allows you to filter by authorization.

You can choose from:

  • All
  • Required
  • Not Required
Group By

You can choose from:

  • All
  • Publisher
  • Application Group
  • Message
  • Workstyle
Ownership

Allows you to group by the type of owner.

You can choose from:

  • All
  • Trusted owner
  • Untrusted owner
Matched

Allows you to filter on the type of matching.

You can choose from:

  • All
  • Matched directly
  • Matched as child
Other Actions

Allows you to filter by other actions.

You can choose from:

  • Custom
  • Drop Admin Rights
  • Enforce Default Rights
Details Process Details

Advanced Filter Panel

The Filter Panel dropdown bar is located above the Toolbar. Click the bar to toggle the filter panel.

Filter Panel Dropdown Bar

The Filter Panel is available from most dashboards and reports, and allows you to filter data based on a number of event properties. To access the Filter Panel at any time, click the filter dropdown button shown above.

For example, if you want to filter the Summary report to only include a specific Workstyle:

  1. Open the report to filter.
  2. Open the Filter Panel by clicking the filter dropdown list.
  3. Select the Workstyle you are interested in from the Workstyle dropdown list.
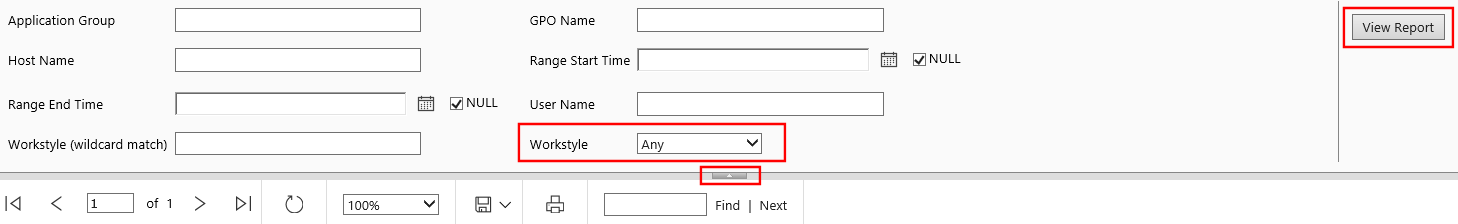
Select the desired workstyle from the Workstyle dropdown.

  1. Click View Report.
  2. Close the Filter Panel.

The report then shows information from the Developers Workstyle only.

The filter options match text on substrings; partial or complete words can match on a filter.

Certain filter options support comma-separated values so you can specify a list of filter values. For example, to restrict the results to three users, enter user1,user2,user3 in the User Name field.

Multiple ! strings are accepted. For example, !L-CZC13127L30l,!L-CNU410DJJ7

Any text field supports wildcards, comma-separated values (CSV) and the Does Not Match(!) options:

Filtering Effect

Filter Panel Operator

Effect
List separator

Comma (,)

Value1,value2,value3

Wildcard %

part%
part%part2,part3%part4

Negation or "Not" !

!value
!value1,!value2

When filtering tabular reports such as the UsersAll table, an applied filter is displayed at the top of the relevant column. To remove a filter, click on the x next to the filter text.

The Filter Panel includes several properties that can be used to filter the events in the dashboard or report currently in view. See Endpoint Privilege Management Reporting Top Advanced Filter Details.

Top Toolbar

You can use the toolbar to navigate between report pages, change the magnification, search, export, refresh, print, and export to a data feed.

The Toolbar and the Filter Panel are standard Microsoft SSRS components. See What is SQL Server Reporting Services (SSRS).

Export Reports

Dashboards and reports can be exported to any of the following formats using the Export dropdown menu on the toolbar:

  • XML file with report data
  • CSV (comma delimited)
  • PDF
  • MHTML (web archive)
  • Excel
  • TIFF file
  • Word

Exported data is based on the data currently displayed in the dashboard or report.

For more information, see the following:

Permalink to Reports

Each dashboard and report includes a permalink located at the bottom of each report. Permalinks can be used to link directly to views which are configured with advanced filters, eliminating the need to repeatedly set filters for common views.

The permalink is unique to the current report and filters. Changing a filter results in a new permalink being created for that modified view.

To obtain a permalink from a dashboard or report, click the Permalink link at the bottom of the page. The page reloads with a URL that can be copied in the address bar of your web browser.

To copy the permalink URL, right-click the Permalink option and select Copy Shortcut. Alternatively, you can Add the URL as a browser favorite to return easily to a view that may be difficult to recreate.