Endpoint Privilege Management for Mac Performance Reports
Endpoint Privilege Management for Mac (EPM-M) performance reports are available for the following versions:
EPM-M 24.1 Performance Report
Introduction
The aim of this document is to provide data on agreed performance metrics of the EPM-M desktop client compared to the previous release.
The content of this document should be used to provide general guidance only. The are many different factors in a live environment which could show different results such as hardware configuration, macOS configuration and background activities, 3rd party products, and the nature of the EPM policy being used.
Performance Benchmarking
Test Scenario
The tests were ran on an Parallels virtual machine with the following configuration:
- macOS: 13.4.1
- Apple Silicon
- 8GB RAM
Tests were completed with the GA releases.
- 23.9.1.1
- 24.1
Test Names
- Quick Start policy in High flex, admin user
- Running the Automation Tests Suite with a Monitoring tool
- Installing and building Qt5 from source
Test Method
We have included three methods to test our product, all make use of the caching feature.
There were three types of tests conducted:
- The first one uses the default quick start policy where we expect to match on an allowed binary with no dialog presented to the user, ensuring consistency and reducing user interaction.
- The next one involves running our Automation Tests Suite and measuring the components resource consumption. We conduct tests on all of our core functionality with our automation suite and keeps our software under load for approximately an hour. We’ve used the Automation Tests Suite to portray as close as possible a real life environment usage and to monitor PMfM through all types of intensive and non intensive scenarios.
- The last one is about installing the Qt5 package on the system and building it from source to simulate a developer environment trying to set it up and compile code. We use the hyperfine tool to run the 'HOMEBREW_NO_AUTO=1 brew reinstall qt@5' command which executes it 10 times in a row and times the minimum and maximum in seconds for each run, also producing the mean values.
The quick start policy is the policy that's most commonly used as a base for all of our customers. It can be applied by the MMC and WPE with Import Template. It was chosen as it's our most common use case. The binary we're launching is bash with the -help argument, and we run it through the hyperfine tool during the test process to produce the minimum, maximum and mean time of our rule matching engine.
For more information on how to use our caching feature, see Configure Caching on Policies.
Summary
Comparing 23.9.1 results against 24.1, we can observe no major differences between these two builds when caching is disabled but there is a 10-15% improvement when caching is enabled. This is due to a new performance improvement feature that introduces caching for file reads on the system.
The tests were done at a micro level focusing on a single binary and at a macro level focusing on multiple binaries being run while installing and building from source.
Overall there is no performance degradation and the resource consumption differences between the automation runs are negligible, with a substantial performance improvement when caching is enabled.
Results
Rule Matching Latency
Note: Hyperfine v1.18. used both 23.9.1 and 24.1 for the results of tests 1 and 3.
|
Test/version |
Mean |
Min |
Max |
|---|---|---|---|
|
23.9.1 Process Matching Rule Latency No Caching |
4.6 ms ± 1.8 ms |
3.4 |
10.1 |
|
24.1 Process Matching Rule Latency No Caching |
4.6 ms ± 1.0 ms |
2.1 ms |
11.2 ms |
|
23.9.1 Process Matching Rule Latency With Caching |
615.8 µs ± 323.3 µs |
209.1 µs |
1888.5 µs |
|
24.1 Process Matching Rule Latency With Caching |
1.2 ms ± 0.4 ms |
0.6 ms |
2.9 ms |
|
No PMfM installed |
965.3 µs ± 338.9 µs |
468.2 µs |
2245.1 µs |
µs is microsecond. ms is millisecond.
We’ve included a visualization of the resources our components are using when running the following command on the 24.1 release candidate with caching disabled:
Hyperfine --runs 1000 'bash -help'
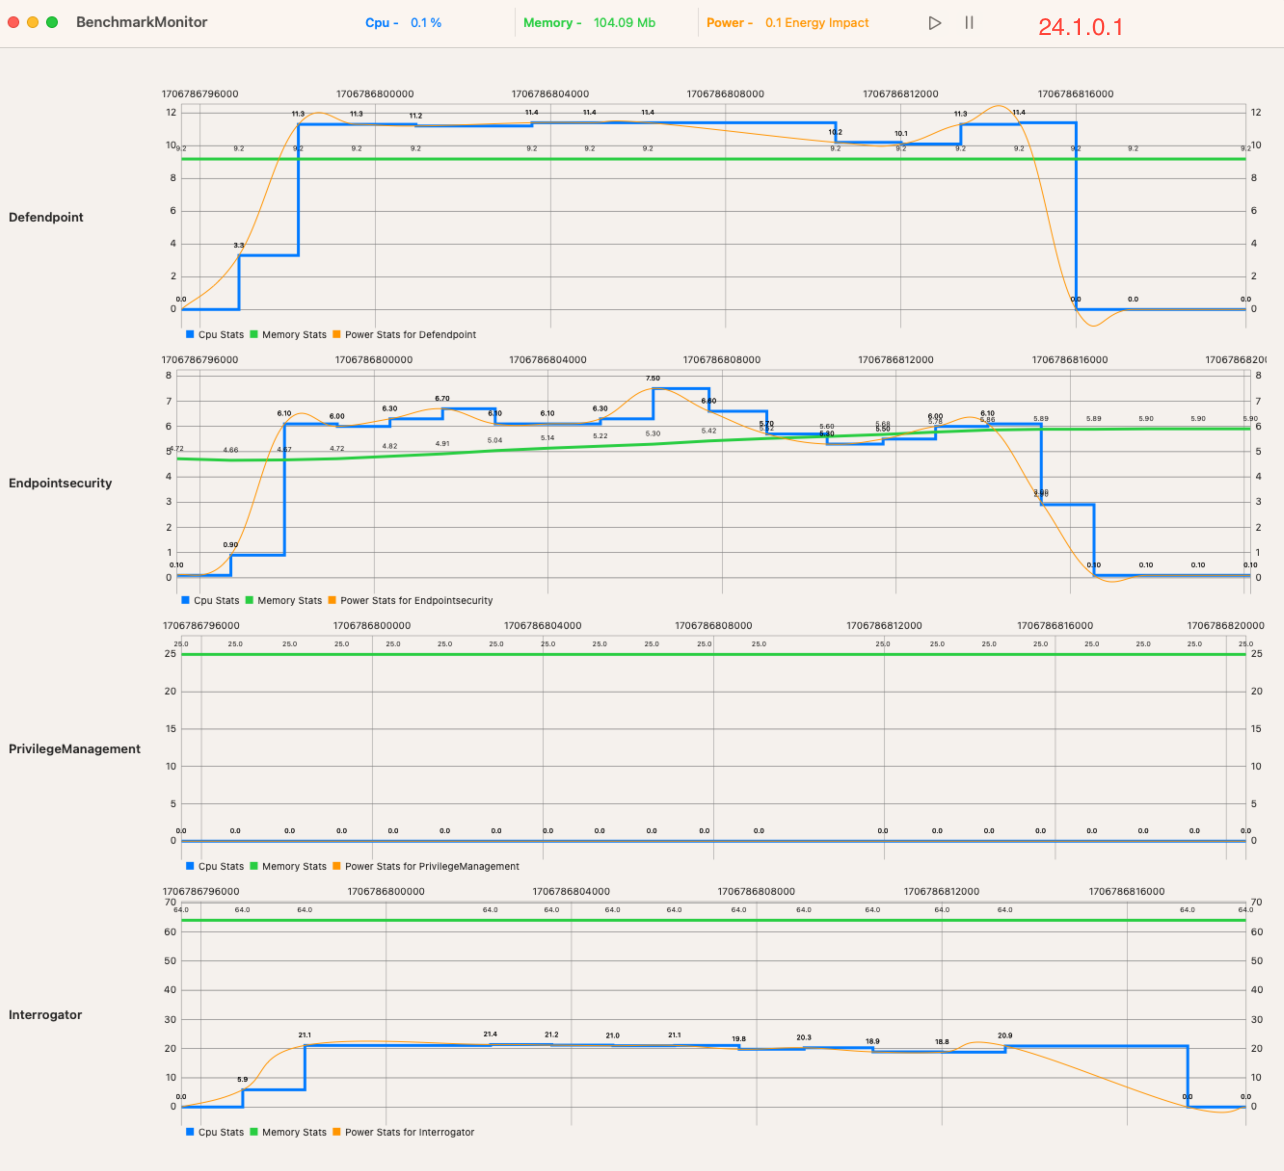
This shows how our components under load using the command and for a short time after, which is due to our components needing additional time to fully compute the 1000 actions in this test case.
All resources drop to near zero after that.
Automation Tests Resource Consumption per Component
Defendpoint Component
Process Load ( % )
|
Test/version |
Mean |
Min |
Max |
|---|---|---|---|
|
24.1 |
0.378 |
0 |
5.6 |
|
23.9.1 |
1.162 |
0 |
11.8 |
|
23.9 |
0.785 |
0 |
7.4 |
Memory (MB)
|
Test/version |
Mean |
Min |
Max |
|---|---|---|---|
|
24.1 |
10.454 |
5.825 |
16 |
|
23.9.1 |
9.778 |
5.537 |
14 |
|
23.9 |
8.937 |
5.537 |
12 |
Energy Impact
|
Test/version |
Mean |
Min |
Max |
|---|---|---|---|
|
24.1 |
0.378 |
0 |
5.6 |
|
23.9.1 |
1.163 |
0 |
11.8 |
|
23.9 |
0.788 |
0 |
9.3 |
PrivilegeManagement Component
Process Load ( % )
|
Test/version |
Mean |
Min |
Max |
|---|---|---|---|
|
24.1 |
0.020 |
0 |
9.1 |
|
23.9.1 |
0.513 |
0 |
10.1 |
|
23.9 |
0.575 |
0 |
17.5 |
Memory (MB)
|
Test/version |
Mean |
Min |
Max |
|---|---|---|---|
|
24.1 |
10.340 |
9.586 |
32 |
|
23.9.1 |
8.340 |
4.497 |
14 |
|
23.9 |
28.259 |
4.897 |
35 |
Energy Impact
|
Test/version |
Mean |
Min |
Max |
|---|---|---|---|
|
24.1 |
0.0295 |
0 |
9.3 |
|
23.9.1 |
0.528 |
0 |
10.1 |
|
23.9 |
0.787 |
0 |
17.9 |
EndpointSecurity Component
Process Load ( % )
|
Test/version |
Mean |
Min |
Max |
|---|---|---|---|
|
24.1 |
0.405 |
0 |
2.9 |
|
23.9.1 |
1.046 |
0 |
10.1 |
|
23.9 |
0.936 |
0 |
16.7 |
Memory (MB)
|
Test/version |
Mean |
Min |
Max |
|---|---|---|---|
|
24.1 |
5.736 |
4.353 |
6.081 |
|
23.9.1 |
5.990 |
4.497 |
6.161 |
|
23.9 |
5.571 |
4.433 |
5.665 |
Energy Impact
|
Test/version |
Mean |
Min |
Max |
|---|---|---|---|
|
24.1 |
0.433 |
0 |
2.9 |
|
23.9.1 |
1.095 |
0 |
10.1 |
|
23.9 |
0.979 |
0 |
16.7 |
Interrogator Component
Process Load ( % )
|
Test/version |
Mean |
Min |
Max |
|---|---|---|---|
|
24.1 |
0.465 |
0 |
5.7 |
|
23.9.1 |
3.517 |
0 |
28.6 |
|
23.9 |
2.149 |
0 |
19.8 |
Memory (MB)
|
Test/version |
Mean |
Min |
Max |
|---|---|---|---|
|
24.1 |
107.954 |
4.898 |
137 |
|
23.9.1 |
98.365 |
7.665 |
134 |
|
23.9 |
107.904 |
6.097 |
143 |
Energy Impact
|
Test/version |
Mean |
Min |
Max |
|---|---|---|---|
|
24.1 |
0.465 |
0 |
5.7 |
|
23.9.1 |
3.517 |
0 |
28.6 |
|
23.9 |
2.149 |
0 |
19.8 |
Install and Build Qt5 from Source with a Quickstart High Flexibility Policy Applied
Hyperfine --runs 10 'HOMEBREW_NO_AUTO=1 brew reinstall qt@5'
|
Test/version |
Mean(sec) |
Min(sec) |
Max(sec) |
|---|---|---|---|
|
23.9.1 with Caching Disabled |
36.242 ± 0.317 |
35.715 |
36.631 |
|
24.1 with Caching Disabled |
39.747 ± 0.765 |
38.058 |
40.558 |
|
23.9.1 with Caching Enabled |
29.470 ± 0.408 |
28.890 |
30.342 |
|
24.1 with Caching Enabled |
35.653 s ± 1.002 s |
33.657 |
36.570 |
|
No PMfM installed |
27.226 s ± 0.807 s |
25.804 |
28.146 |
EPM-M 23.9 Performance Report
Introduction
The aim of this document is to provide data on the agreed performance metrics of the EPM-M desktop client compared to the previous release.
The content of this document provides general guidance only. There are many different factors in a live environment, which could show different results such as hardware configuration, macOS configuration and background activities, third-party products, and the nature of the EPM policy being used.
Performance Benchmarking
Test Scenario
The tests were run on a Parallels virtual machine with the following configuration:
- macOS: 13.4.1
- Apple Silicon
- 8GB RAM
Tests were completed with the GA releases.
- 23.7.0.1
- 23.9.0.1
Test Names
- QuickStart policy in High Flexibility, admin user
- Automation Tests Suite run with a Monitoring tool
- Qt5 installed and built from source
Test Method
We have included three methods to test our product. All three make use of the caching feature.
- The first test uses the default QuickStart policy, where we expect to match on an allowed binary with no dialog presented to the user, ensuring consistency and reducing user interaction.
- The next one involves running our Automation Tests Suite and measuring the components resource consumption. We conduct tests on all of our core functionality with our automation suite and keep our software under load for approximately an hour. We’ve used the Automation Tests Suite to portray as close as possible a real life environment usage and to monitor EPM-M through all types of intensive and non-intensive scenarios.
- The final test involves installing the Qt5 package on the system and building it from source, simulating a developer environment's effort to set it up and compile code. We use the hyperfine tool to run the HOMEBREW_NO_AUTO=1 brew reinstall qt@5 command, which executes it 10 times in a row and multiplies the minimum and maximum in seconds for each run, producing the mean values.
The QuickStart policy is the one most commonly used as a base for all of our customers. It can be applied by the MMC and WPE with Import Template. It was chosen because it's our most common use case. The binary we're launching is bash with the -help argument, and we run it through the hyperfine tool during the test process to produce the minimum, maximum, and mean time of our rule-matching engine.
For more information on how to use our caching feature, see Configure Caching on Policies.
Summary
Comparing 23.9 results against 23.7, we can observe no major differences between these two builds when caching is disabled but there is a 10-15% improvement when caching is enabled. This is due to a new performance improvement feature which introduces caching for file reads on the system.
The tests were done at a micro level focusing on a single binary and at a macro level focusing on multiple binaries being run while installing and building from source.
Overall there is no performance degradation and the resource consumption differences between the automation runs are negligible, with a substantial performance improvement when caching is enabled.
Results
Rule Matching Latency
A limitation of Hyperfine version 1.15 (used to test 23.7) has been fixed where small amounts of time were recorded differently. Unable to use this version for 22.9, (1.18. used) both 23.7 and 23.9 were retested under this new version for the results of tests 1 and 3.
Further the automation tests were re-done for 23.7 as a new environment was used for this testing.
| Test/Version | Mean | Min | Max |
|---|---|---|---|
| 23.7 Process Matching Rule Latency No Caching | 5.2 ms ± 1.5 ms | 3.3 ms | 14.7 ms |
| 23.9 Process Matching Rule Latency No Caching | 5.0 ms ± 1.0 ms | 3.7 ms | 11.1 ms |
| 23.7 Process Matching Rule Latency With Caching | 741.1 µs ± 397.8 µs | 284.1 µs | 2570.2 µs |
| 23.9 Process Matching Rule Latency With Caching | 692.2 µs ± 369.5 µs | 306.9 µs | 3110.8 µs |
| No PMfM installed | 615.3 µs ± 240.1 µs | 338.2 µs | 1877.3 µs |
µs is microsecond. ms is millisecond.
We’ve included a visualization of the resources our components are using when running the following command on the 23.9 release candidate with caching disabled:
Hyperfine --runs 1000 'bash -help'
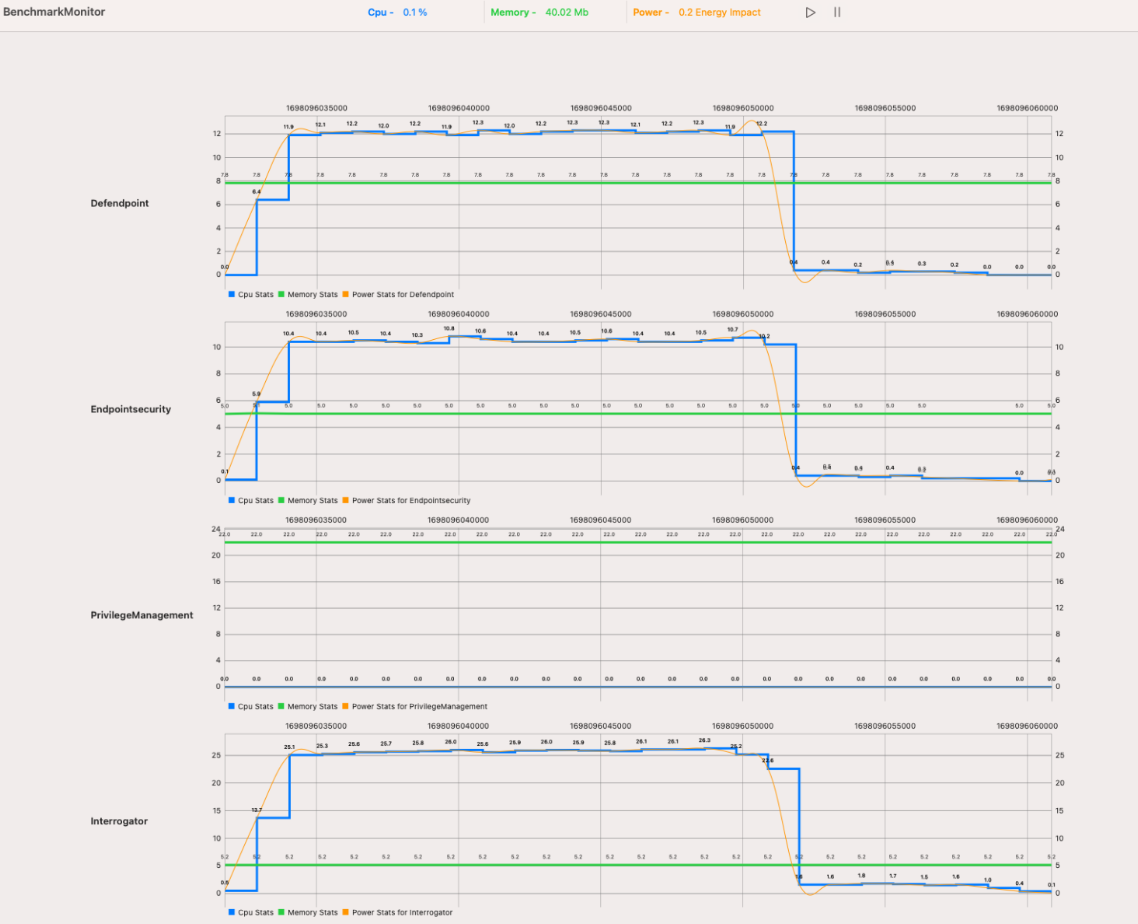
This shows our components under load using the command and for a short time after, which is due to our components needing additional time to fully compute the 1000 actions in this test case.
All resources drop to near-zero after that.
Automation Tests Resource Consumption Per Component
Defendpoint Component
Process Load ( % )
| Test/Version | Mean | Min | Max |
|---|---|---|---|
| 23.9 | 0.785 | 0 | 7.4 |
| 23.7 | 0.799 | 0 | 9.8 |
Memory (MB)
| Test/Version | Mean | Min | Max |
|---|---|---|---|
| 23.9 | 8.937 | 5.537 | 12 |
| 23.7 | 9.263 | 5.217 | 15 |
Energy Impact
| Test/Version | Mean | Min | Max |
|---|---|---|---|
| 23.9 | 0.788 | 0 | 9.3 |
| 23.7 | 0.802 | 0 | 9.8 |
PrivilegeManagement Component
Process load ( % )
| Test/Version | Mean | Min | Max |
|---|---|---|---|
| 23.9 | 0.575 | 0 | 17.5 |
| 23.7 | 0.541 | 0 | 14.4 |
Memory (MB)
| Test/Version | Mean | Min | Max |
|---|---|---|---|
| 23.9 | 28.259 | 4.897 | 35 |
| 23.7 | 28.059 | 18 | 35 |
Energy Impact
| Test/Version | Mean | Min | Max |
|---|---|---|---|
| 23.9 | 0.787 | 0 | 17.9 |
| 23.7 | 0.726 | 0 | 15.7 |
EndpointSecurity Component
Process load ( % )
| Test/Version | Mean | Min | Max |
|---|---|---|---|
| 23.9 | 0.936 | 0 | 16.7 |
| 23.7 | 0.985 | 0 | 16 |
Memory (MB)
| Test/Version | Mean | Min | Max |
|---|---|---|---|
| 23.9 | 5.571 | 4.433 | 5.665 |
| 23.7 | 5.584 | 3.057 | 5.729 |
Energy Impact
| Test/Version | Mean | Min | Max |
|---|---|---|---|
| 23.9 | 0.979 | 0 | 16.7 |
| 23.7 | 1.024 | 0 | 16 |
Interrogator Component
Process load ( % )
| Test/Version | Mean | Min | Max |
|---|---|---|---|
| 23.9 | 2.149 | 0 | 19.8 |
| 23.7 | 2.140 | 0 | 23.7 |
Memory (MB)
| Test/Version | Mean | Min | Max |
|---|---|---|---|
| 23.9 | 107.904 | 6.097 | 143 |
| 23.7 | 106.080 | 3.745 | 135 |
Energy Impact
| Test/Version | Mean | Min | Max |
|---|---|---|---|
| 23.9 | 2.149 | 0 | 19.8 |
| 23.7 | 2.140 | 0 | 23.7 |
Install and Build Qt5 from Source with a Quickstart High Flexibility Policy Applied
Hyperfine --runs 10 'HOMEBREW_NO_AUTO=1 brew reinstall qt@5'
| Test/Version | Mean (sec) | Min (sec) | Max (sec) |
|---|---|---|---|
| 23.7 with Caching Disabled | 34.033 ± 0.790 | 33.307 | 35.931 |
| 23.9 with Caching Disabled | 34.162 ± 0.208 | 33.954 | 34.615 |
| 23.7 with Caching Enabled | 28.526 ± 0.232 | 28.122 | 28.810 |
| 23.9 with Caching Enabled | 28.868 ± 0.214 | 28.562 | 29.197 |
| No EPM-M installed | 20.817 ± 0.444 | 20.251 | 21.598 |
EPM-M 23.7 Performance Report
Introduction
The aim of this document is to provide data on agreed performance metrics of the Endpoint Privilege Management for Mac (EPM-M) desktop client compared to the previous release.
The content of this document should be used to provide general guidance only. The are many different factors in a live environment which could show different results such as hardware configuration, macOS configuration and background activities, 3rd party products, and the nature of the EPM policy being used.
Performance Benchmarking
Test Scenario
The tests were ran on an UTM virtual machine with the following configuration:
- macOS: 13.3.1
- Apple Silicon
- 8GB RAM
Tests were completed with the GA releases.
Test Names
- Quick Start policy in High flex, standard user
- Running the Automation Tests Suite with a Monitoring tool
- Installing and building Qt5 from source
Test Method
We have included three methods to test our product, all make use of the caching feature.
There were three types of tests conducted:
- The first one uses the default quick start policy where we expect to match on an allowed binary with no dialog presented to the user, ensuring consistency and reducing user interaction.
The quick start policy is the policy that's most commonly used as a base for all of our customers. It can be applied by the MMC and WPE with Import Template. It was chosen as it's our most common use case. The binary we're launching is bash with the -help argument, and we run it through the hyperfine tool during the test process to produce the minimum, maximum and mean time of our rule matching engine.
- The next one involves running our Automation Tests Suite and measuring the components resource consumption. We conduct tests on all of our core functionality with our automation suite and keeps our software under load for approximately an hour. We’ve used the Automation Tests Suite to portray as close as possible a real life environment usage and to monitor EPM-M through all types of intensive and non intensive scenarios.
- The last one is about installing the Qt5 package on the system and building it from source to simulate a developer environment trying to set it up and compile code. We use the hyperfine tool to run the HOMEBREW_NO_AUTO=1 brew reinstall qt@5 command which executes it 10 times in a row and times the minimum and maximum in seconds for each run, also producing the mean values.
For more information on how to use our caching feature, see Configure Caching on Policies.
Summary
Comparing 23.7 results against 23.5, we can observe no major differences between these two builds when caching is disabled but there is a 10-15% improvement when caching is enabled. This is due to a new performance improvement feature which introduces caching for file reads on the system.
The tests were done at a micro level focusing on a single binary and at a macro level focusing on multiple binaries being run while installing and building from source.
Overall there is no performance degradation and the resource consumption differences between the automation runs are negligible, with a substantial performance improvement when caching is enabled.
Results
Rule Matching Latency
|
Test/version |
Mean (ms) |
Min (ms) |
Max (ms) |
|---|---|---|---|
|
23.7 Process Matching Rule Latency No Caching |
5.2 ± 1.1 |
3.7 |
14.4 |
|
23.5 Process Matching Rule Latency No Caching |
5.2 ± 1.1 |
3.4 |
9.3 |
|
23.7 Process Matching Rule Latency With Caching |
0.5 ± 0.3 |
0.1 |
2.1 |
|
23.5 Process Matching Rule Latency With Caching |
0.6 ± 0.4 |
0.1 |
2.0 |
|
No EPM-M installed |
0.5 ± 0.2 |
0.1 |
1.9 |
We’ve included a visualization of the resources our components are using when running the following command on the 23.7 release candidate with caching disabled:
Hyperfine --runs 1000 'bash -help'
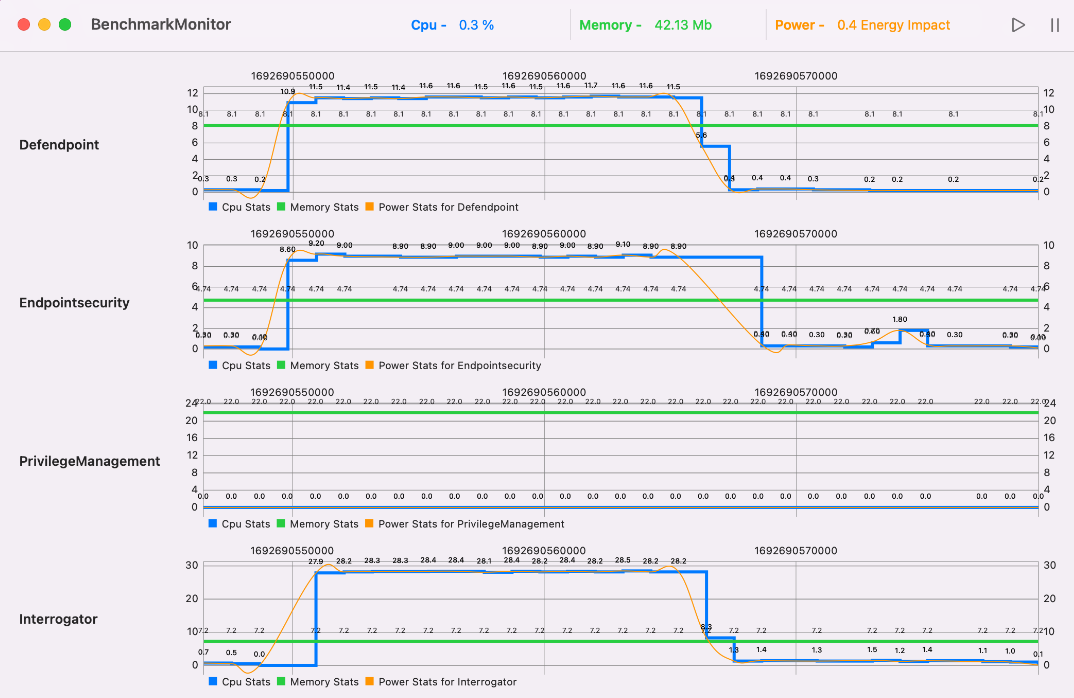
This shows hows our components under load using the command and for a short time after, which is due to our components needing additional time to fully compute the 1000 actions in this test case.
All resource does drop to near zero after that.
Automation Tests Resource Consumption Per Component
Defendpoint Component
Process Load ( % )
|
Test/version |
Mean |
Min |
Max |
|---|---|---|---|
|
23.7 |
0.675 |
0 |
5.6 |
|
23.5 |
0.676 |
0 |
6.4 |
Memory (MB)
|
Test/version |
Mean |
Min |
Max |
|---|---|---|---|
|
23.7 |
9.04 |
5.409 |
11 |
|
23.5 |
8.975 |
5.569 |
11 |
Energy Impact
|
Test/version |
Mean |
Min |
Max |
|---|---|---|---|
|
23.7 |
0.678 |
0 |
5.6 |
|
23.5 |
0.687 |
0 |
6.4 |
PrivilegeManagement Component
Process Load ( % )
|
Test/version |
Mean |
Min |
Max |
|---|---|---|---|
|
23.7 |
0.587 |
0 |
12.1 |
|
23.5 |
1.612 |
0 |
55.50 |
Memory (MB)
|
Test/version |
Mean |
Min |
Max |
|---|---|---|---|
|
23.7 |
28.44 |
18 |
37 |
|
23.5 |
27.98 |
18 |
35 |
Energy Impact
|
Test/version |
Mean |
Min |
Max |
|---|---|---|---|
|
23.7 |
0.82 |
0 |
14.6 |
|
23.5 |
1.911 |
0 |
55.50 |
EndpointSecurity Component
Process Load ( % )
|
Test/version |
Mean |
Min |
Max |
|---|---|---|---|
|
23.7 |
0.696 |
0 |
6.8 |
|
23.5 |
0.748 |
0 |
13.4 |
Memory (MB)
|
Test/version |
Mean |
Min |
Max |
|---|---|---|---|
|
23.7 |
5.468 |
3.217 |
5.601 |
|
23.5 |
5.675 |
4.273 |
5.793 |
Energy Impact
|
Test/version |
Mean |
Min |
Max |
|---|---|---|---|
|
23.7 |
0.732 |
0 |
6.8 |
|
23.5 |
0.771 |
0 |
13.4 |
Interrogator Component
Process Load ( % )
|
Test/version |
Mean |
Min |
Max |
|---|---|---|---|
|
23.7 |
2.064 |
0 |
20.6 |
|
23.5 |
2.017 |
0 |
22.7 |
Memory (MB)
|
Test/version |
Mean |
Min |
Max |
|---|---|---|---|
|
23.7 |
127.64 |
3.809 |
158 |
|
23.5 |
135.75 |
0 |
162 |
Energy Impact
|
Test/version |
Mean |
Min |
Max |
|---|---|---|---|
|
23.7 |
2.065 |
0 |
20.6 |
|
23.5 |
2.018 |
0 |
22.7 |
Install and Build Qt5 from Source with a Quickstart High Flexibility Policy Applied
|
Test/version |
Mean(sec) |
Min(sec) |
Max(sec) |
|---|---|---|---|
|
23.7 with Caching Disabled |
85.439 ± 2.480 |
81.043 |
89.029 |
|
23.5 with Caching Disabled |
84.185 ± 2.683 |
79.580 |
87.347 |
|
23.7 with Caching Enabled |
51.211 ± 0.820 |
50.313 |
52.723 |
|
23.5 with Caching Enabled |
54.730 ± 1.461 |
53.397 |
57.619 |
|
No EPM-M installed |
43.069 ± 0.965 |
41.242 |
44.426 |
EPM-M 23.5 Performance Report
Introduction
The aim of this document is to provide data on agreed performance metrics of the EPM-M desktop client compared to the previous release.
The content of this document should be used to provide general guidance only. The are many different factors in a live environment which could show different results such as hardware configuration, macOS configuration and background activities, 3rd party products, and the nature of the EPM policy being used.
Performance Benchmarking
Test Scenario
The tests were ran on an UTM virtual machine with the following configuration:
- macOS: 13.3.1
- Apple Silicon
- 8GB RAM
Tests were completed with the GA releases.
Test Names
- Quick Start policy in High flex, standard user
- Running the Automation Tests Suite with a Monitoring tool
- Installing and building Qt5 from source
Test Method
We have included three methods to test our product, all make use of the caching feature.
There were three types of tests conducted:
- The first one uses the default quick start policy where we expect to match on an allowed binary with no dialog presented to the user, ensuring consistency and reducing user interaction.
The quick start policy is the policy that's most commonly used as a base for all of our customers. It can be applied by the MMC and WPE with Import Template. It was chosen as it's our most common use case. The binary we're launching is bash with the -help argument, and we run it through the hyperfine tool during the test process to produce the minimum, maximum and mean time of our rule matching engine.
- The next one involves running our Automation Tests Suite and measuring the components resource consumption. We conduct tests on all of our core functionality with our automation suite and keeps our software under load for approximately an hour. We’ve used the Automation Tests Suite to portray as close as possible a real life environment usage and to monitor EPM-M through all types of intensive and non intensive scenarios.
- The last one is about installing the Qt5 package on the system and building it from source to simulate a developer environment trying to set it up and compile code. We use the hyperfine tool to run the HOMEBREW_NO_AUTO=1 brew reinstall qt@5 command which executes it 10 times in a row and times the minimum and maximum in seconds for each run, also producing the mean values.
For more information on how to use our caching feature, see Configure Caching on Policies.
Summary
Comparing 23.5 results against 23.3, we can observe no major differences between these two builds. The tests were done at a micro level focusing on a single binary and at a macro level focusing on multiple binaries being run while installing and building from source. Overall there is no noticeable performance degradation and the resource consumption differences between the automation runs are negligible, in some instances better than the previous release version.
Results
Rule Matching Latency
|
Test/version |
Mean (ms) |
Min (ms) |
Max (ms) |
|---|---|---|---|
|
23.5 Process Matching Rule Latency No Caching |
5.2 ± 1.1 |
3.4 |
9.3 |
|
23.3 Process Matching Rule Latency No Caching |
5.6 ± 1.2 |
3.7 |
9.5 |
|
23.5 Process Matching Rule Latency With Caching |
0.6 ± 0.4 |
0.1 |
2.0 |
|
23.3 Process Matching Rule Latency With Caching |
0.8 ± 0.4 |
0.3 |
2.4 |
|
No EPM-M installed |
0.5 ± 0.2 |
0.1 |
1.9 |
We’ve included a visualization of the resources our components are using when running the following command on 23.5 release:
Hyperfine --runs 1000 'bash -help'
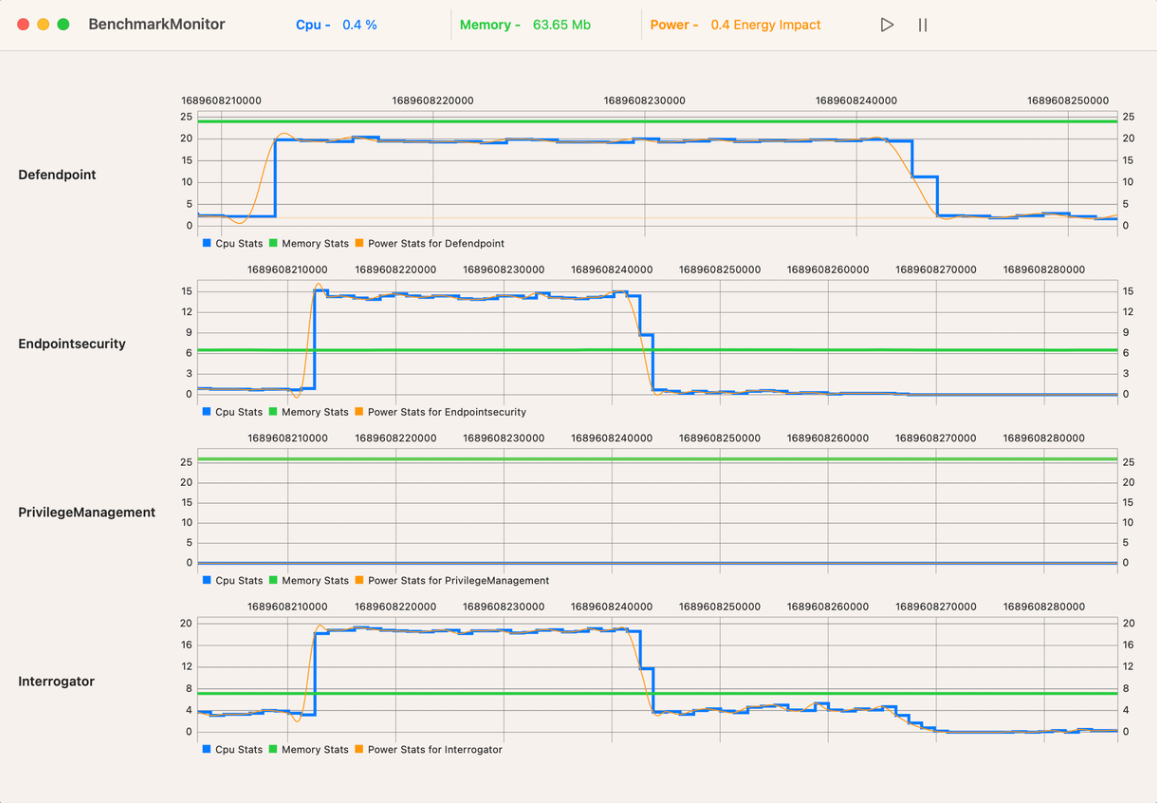
This shows hows our components under load using the command and for a short time after, which is due to our components needing additional time to fully compute the 1000 actions in this test case.
All resource does drop to near zero after that.
Automation Tests Resource Consumption Per Component
Defendpoint Component
Process Load ( % )
|
Test/version |
Mean |
Min |
Max |
|---|---|---|---|
|
23.5 |
0.676 |
0 |
6.4 |
|
23.3 |
1.005 |
0 |
14.6 |
Memory (MB)
|
Test/version |
Mean |
Min |
Max |
|---|---|---|---|
|
23.5 |
8.975 |
5.569 |
11 |
|
23.3 |
8.622 |
5.681 |
10 |
Energy Impact
|
Test/version |
Mean |
Min |
Max |
|---|---|---|---|
|
23.5 |
0.687 |
0 |
6.4 |
|
23.3 |
1.01 |
0 |
14.7 |
PrivilegeManagement Component
Process Load ( % )
|
Test/version |
Mean |
Min |
Max |
|---|---|---|---|
|
23.5 |
1.612 |
0 |
55.50 |
|
23.3 |
0.916 |
0 |
55.10 |
Memory (MB)
|
Test/version |
Mean |
Min |
Max |
|---|---|---|---|
|
23.5 |
27.98 |
18 |
35 |
|
23.3 |
25.17 |
16 |
34 |
Energy Impact
|
Test/version |
Mean |
Min |
Max |
|---|---|---|---|
|
23.5 |
1.911 |
0 |
55.50 |
|
23.3 |
1.229 |
0 |
55.10 |
EndpointSecurity Component
Process Load ( % )
|
Test/version |
Mean |
Min |
Max |
|---|---|---|---|
|
23.5 |
0.748 |
0 |
13.4 |
|
23.3 |
0.782 |
0 |
9.5 |
Memory (MB)
|
Test/version |
Mean |
Min |
Max |
|---|---|---|---|
|
23.5 |
5.675 |
4.273 |
5.793 |
|
23.3 |
5.526 |
4.241 |
5.649 |
Energy Impact
|
Test/version |
Mean |
Min |
Max |
|---|---|---|---|
|
23.5 |
0.771 |
0 |
13.4 |
|
23.3 |
0.806 |
0 |
9.5 |
Interrogator Component
Process Load ( % )
|
Test/version |
Mean |
Min |
Max |
|---|---|---|---|
|
23.5 |
2.017 |
0 |
22.7 |
|
23.3 |
2.158 |
0 |
25 |
Memory (MB)
|
Test/version |
Mean |
Min |
Max |
|---|---|---|---|
|
23.5 |
135.75 |
0 |
162 |
|
23.3 |
134.63 |
5.121 |
161 |
Energy Impact
|
Test/version |
Mean |
Min |
Max |
|---|---|---|---|
|
23.5 |
2.018 |
0 |
22.7 |
|
23.3 |
2.158 |
0 |
25 |
Install and Build Qt5 from Source with a Quickstart High Flexibility Policy Applied
|
Test/version |
Mean(sec) |
Min(sec) |
Max(sec) |
|---|---|---|---|
|
23.5 with Caching Disabled |
84.185 ± 2.683 |
79.580 |
87.347 |
|
23.3 with Caching Disabled |
86.424 ± 3.141 |
82.288 |
94.096 |
|
23.5 with Caching Enabled |
54.730 ± 1.461 |
53.397 |
57.619 |
|
23.3 with Caching Enabled |
53.231 ± 1.422 |
51.611 |
55.703 |
EPM-M 23.3
Introduction
The aim of this document is to provide data on agreed performance metrics of the Endpoint Privilege Management for Mac (EPM-M) desktop client compared to the previous release.
The content of this document should be used to provide general guidance only. The are many different factors in a live environment which could show different results such as hardware configuration, macOS configuration and background activities, 3rd party products, and the nature of the EPM policy being used.
Performance Benchmarking
Test Scenario
Tests are ran on physical devices with the following configuration:
- macOS:13.3.1
- Macbook Air 2020, Apple Silicon
- 16GB RAM
Tests were completed with the GA releases.
Test Name
Quick Start policy in High flex, standard user
Test Method
This test involves a default quick start policy where we match on a policy to not present a dialog for the user, this ensures consistent and reduce user interaction. The application is the latest version of Microsoft Word. Performance metrics are collected with a combination of macOS native binary.
The quick start policy is the policy that's most commonly used as a base for all of our customers. It can be applied by the MMC and WPE with Import Template. It was chosen as it's our most common use case. The application we're launching is /Applications/Microsoft Word.app repeatedly during the test and the values are collected for use for the report.
We can collect the latency of the application launch for when we are installed and not installed but our component metrics can not be gathered when not installed.
Summary
When comparing 23.3 results against 23.1, we can see an improvement of performance which is due to a new feature we have introduced in 23.3. The feature is referenced on release notes as “Introduced caching functionality to store repeated user actions”, which is focused on improving the performance of our product. This will improve the results of our performance benchmark results as we are caching the results in virtual memory to be used again so that policy evaluation is not required for subsequent actions. This can be seen in process load results of Defendpoint as this process handles most of the calculations in our product.
Results
Rule Matching Latency
|
Test/version |
Mean |
Min |
Max |
|---|---|---|---|
|
23.3 Process Matching Rule Latency (ms) |
0.092 |
0.017 |
0.047 |
|
23.1 Process Matching Rule Latency (ms) |
0.097 |
0.027 |
0.047 |
|
No EPM-M installed (ms) |
0.066 |
0.017 |
0.033 |
Process Load ( % ) Defendpoint
|
Test/version |
Mean |
Min |
Max |
|---|---|---|---|
|
23.3 with caching |
1.017 |
0.04 |
1.7 |
|
23.3 without caching |
1.525 |
0.8 |
2.2 |
|
23.1 |
2.14 |
1.7 |
2.6 |
Memory (MB) Defendpoint
|
Test/version |
Mean |
Min |
Max |
|---|---|---|---|
|
23.3 with caching |
7.32 |
7.31 |
7.33 |
|
23.3 without caching |
7.617 |
7.617 |
7.617 |
|
23.1 |
7.27 |
7.20 |
7.31 |
Energy Impact - Defendpoint
|
Test/version |
Mean |
Min |
Max |
|---|---|---|---|
|
23.3 with caching |
1.017 |
0.04 |
1.7 |
|
23.3 without caching |
1.525 |
0.8 |
2.2 |
|
23.1 |
2.14 |
1.7 |
2.6 |
Process Load ( % ) PrivilegeManagement
|
Test/version |
Mean |
Min |
Max |
|---|---|---|---|
|
23.3 with caching |
0 |
0 |
0 |
|
23.3 without caching |
0 |
0 |
0 |
|
23.1 |
0 |
0 |
0 |
Memory (MB) PrivilegeManagement
|
Test/version |
Mean |
Min |
Max |
|---|---|---|---|
|
23.3 with caching |
18 |
18 |
18 |
|
23.3 without caching |
18 |
18 |
18 |
|
23.1 |
20 |
20 |
20 |
Energy Impact - PrivilegeManagement
|
Test/version |
Mean |
Min |
Max |
|---|---|---|---|
|
23.3 with caching |
0 |
0 |
0 |
|
23.3 without caching |
0 |
0 |
0 |
|
23.1 |
0 |
0 |
0 |