Summary Dashboard
The bar charts on the dashboard represent the most important activity that has occurred in the time period defined by the quick filter.
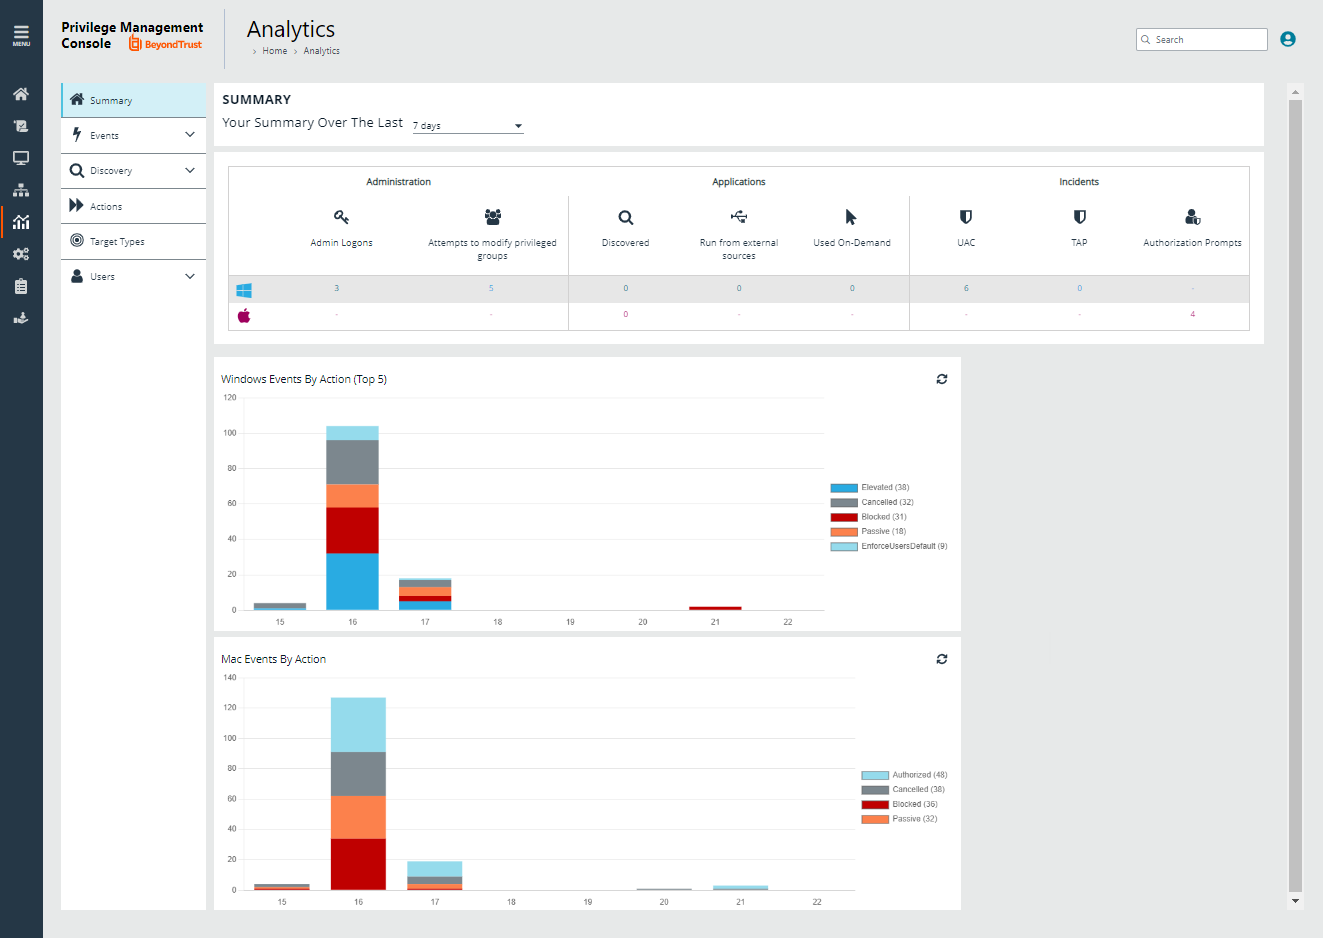
The Administration, Applications, and Incidents tables provide information to help inform Workstyle development or to show anomalous user behavior in your organization.
When available, drill down to see more details.
| Table | Description |
|---|---|
|
Admin logons |
Summarizes the number of admin logons, how many users carried them out, and how many endpoints were used. |
|
Attempts to modify privileged groups |
The number of blocked attempts to modify privileged groups. |
|
Discovered |
The total number of newly discovered Applications split by the type of user rights required:
|
|
Run from external sources |
The number of applications that were run from external sources. |
| Used On-Demand | The number of applications that were used on-demand. |
|
UAC |
The number of applications that triggered User Account Control (UAC). |
|
TAP |
The number of Trusted Application (TAP) incidents, how many users, and how many endpoints were affected. |
| Authorization Prompts | The number of incidents that prompted an authorization request. |