Work with pivot grids in an on-premises BeyondInsight deployment
Using pivot grids, you can interact with multidimensional data from the BeyondInsight cube and can create custom views of the data. Pivot grids use standard analytical cube features:
- Measures: Provide the calculated data values that you want to view.
- Dimensions: Provide the filters, groups, and labels for the view.
Pivot grids are available only for BeyondInsight and Password Safe on-premises deployments.
Create a pivot grid
Using the measures and dimensions provided in the BeyondInsight Analytics & Reporting Pivot Grid feature, you can build comprehensive pivot grid views to analyze your data, as detailed below.
- From the left menu, navigate to Menu > Analytics & Reporting > Pivot Grid.
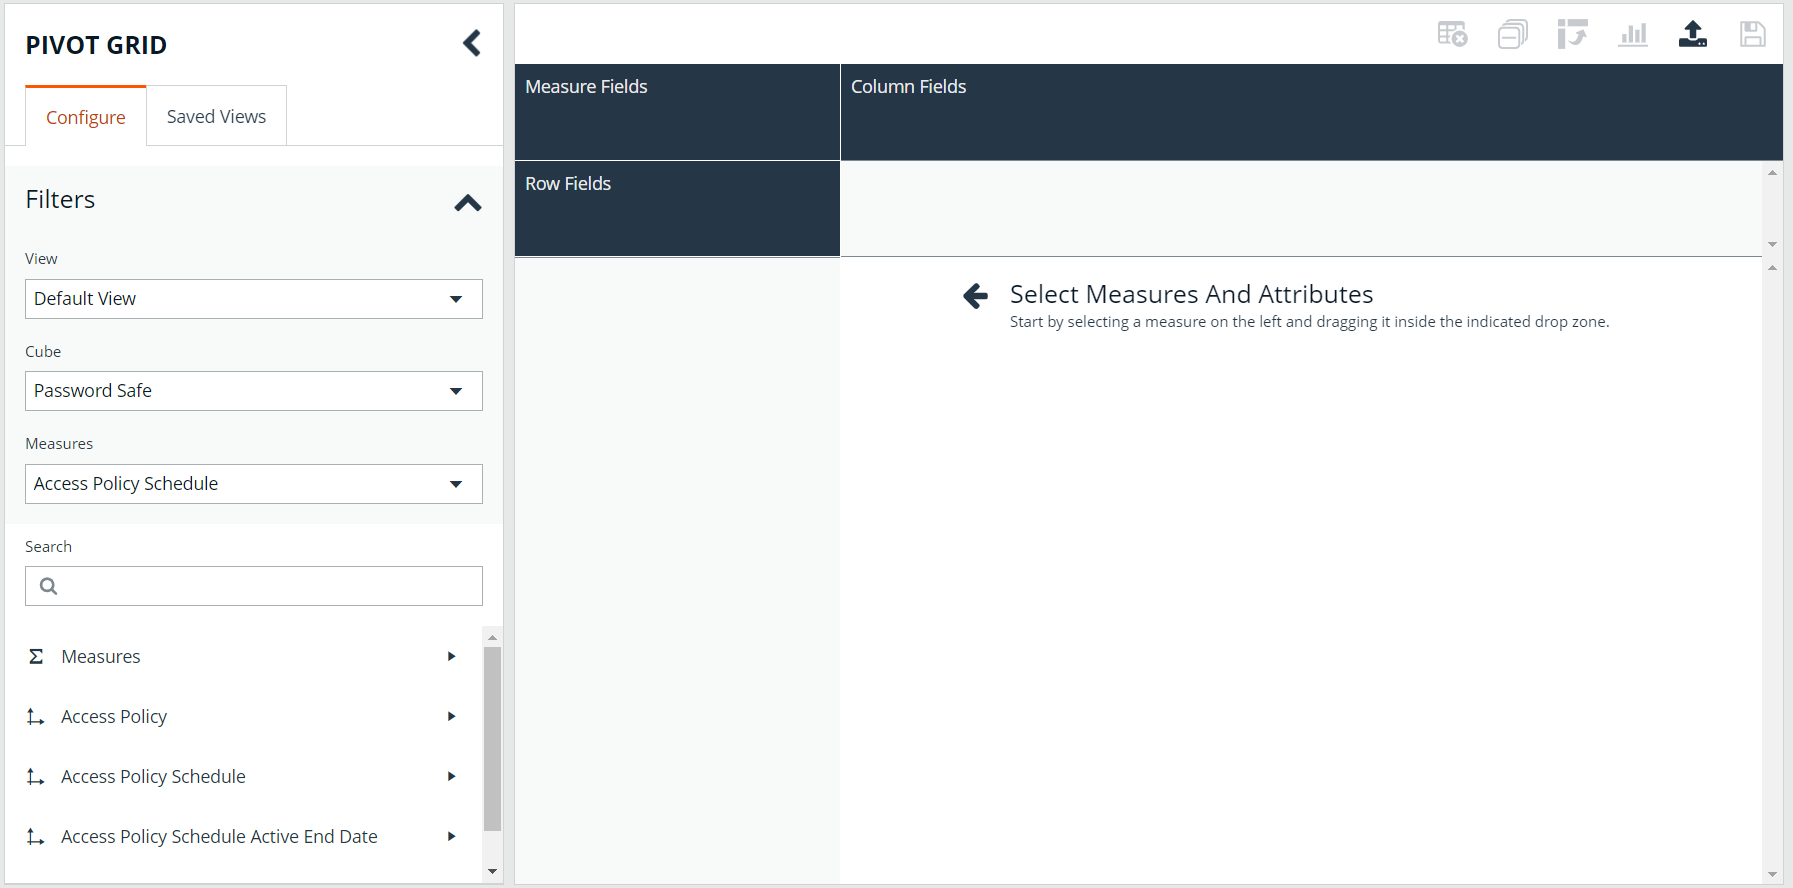
- From the Configure panel, under Filters, select a View, a Cube, and Measures. You can perform a keyword search to find measures and attributes that contain specific words.
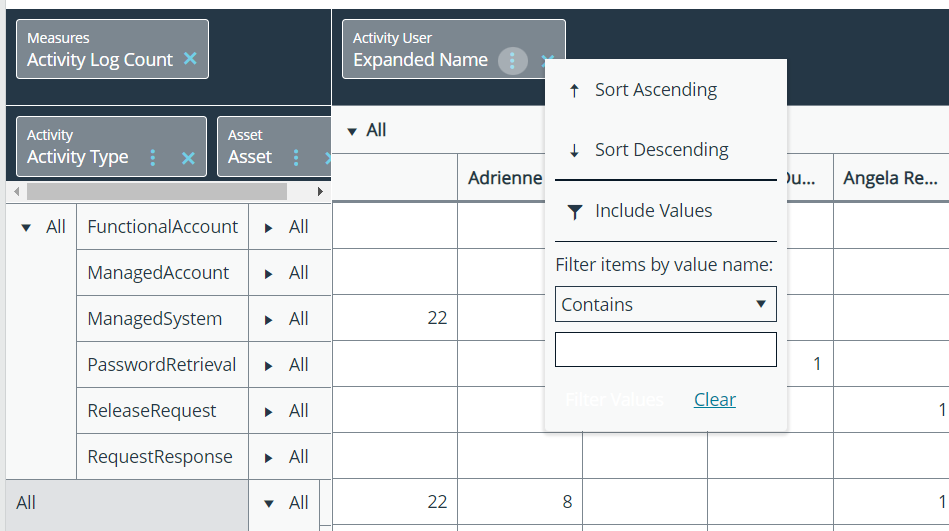
- Drag and drop measures and dimensions on indicated drop zones: Measure Fields, Column Fields, and Row Fields.
- Drag and drop multiple dimensions to enable more options that you can drill down through.
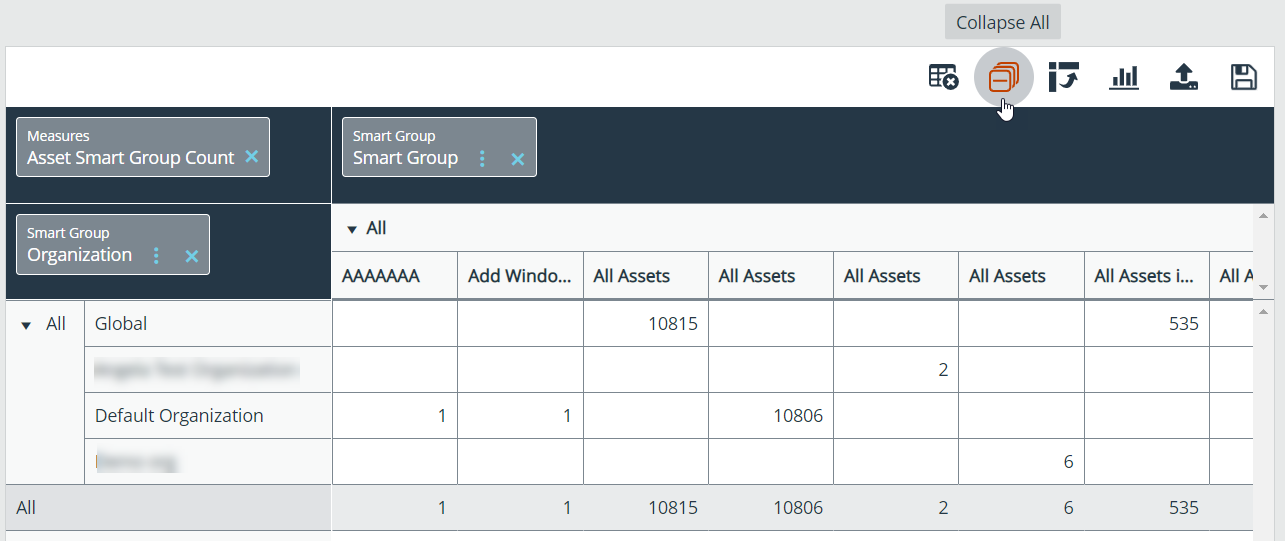
- The available information populates the grid once the fields are selected. Click the Collapse All button in the toolbar above the grid to hide all available data. Click All in the column or row to expand the data.
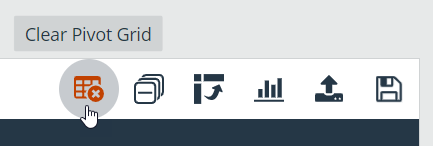
- To completely clear the pivot grid and start over, click Clear Pivot Grid in the toolbar.
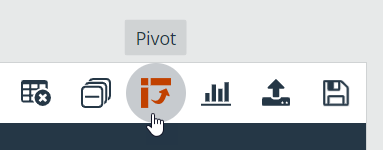
- To pivot your data in the grid, click Pivot in the toolbar. This converts the rows to columns and the columns to rows.
Save pivot grid views
Once you have created a pivot grid, you can save the selected filters, measures, and dimensions as a view for later use.
- In the pivot grid toolbar, click Save, and then select Save as View.
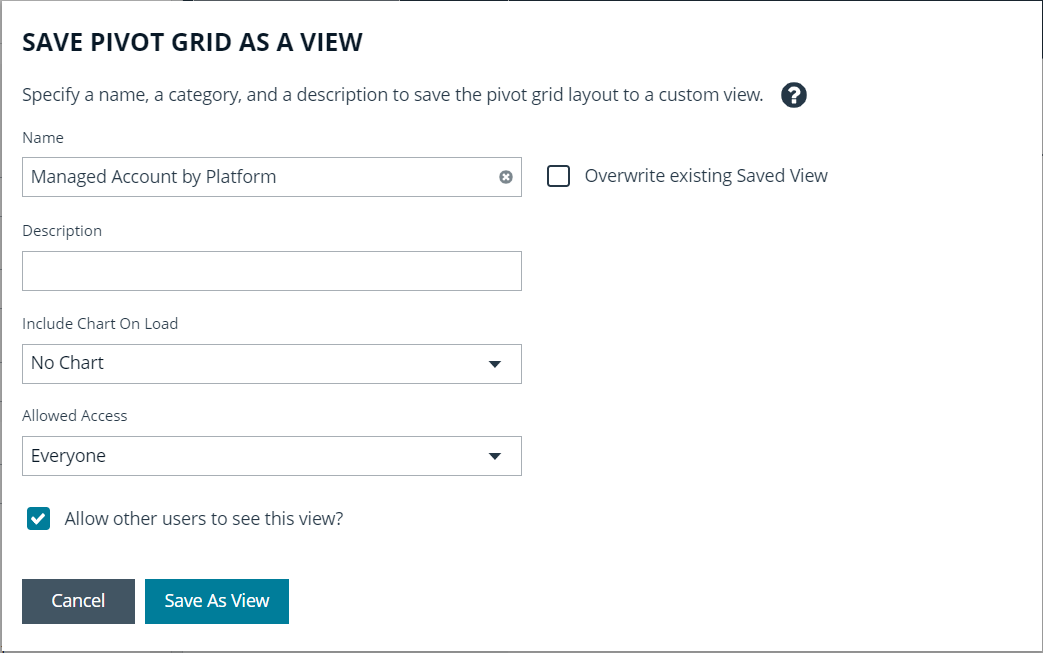
- Enter a Name and Description.
- Select the appropriate group for Allowed Access.
- Choose whether other BeyondInsight users can see the saved pivot grid.
- Click Save As View.
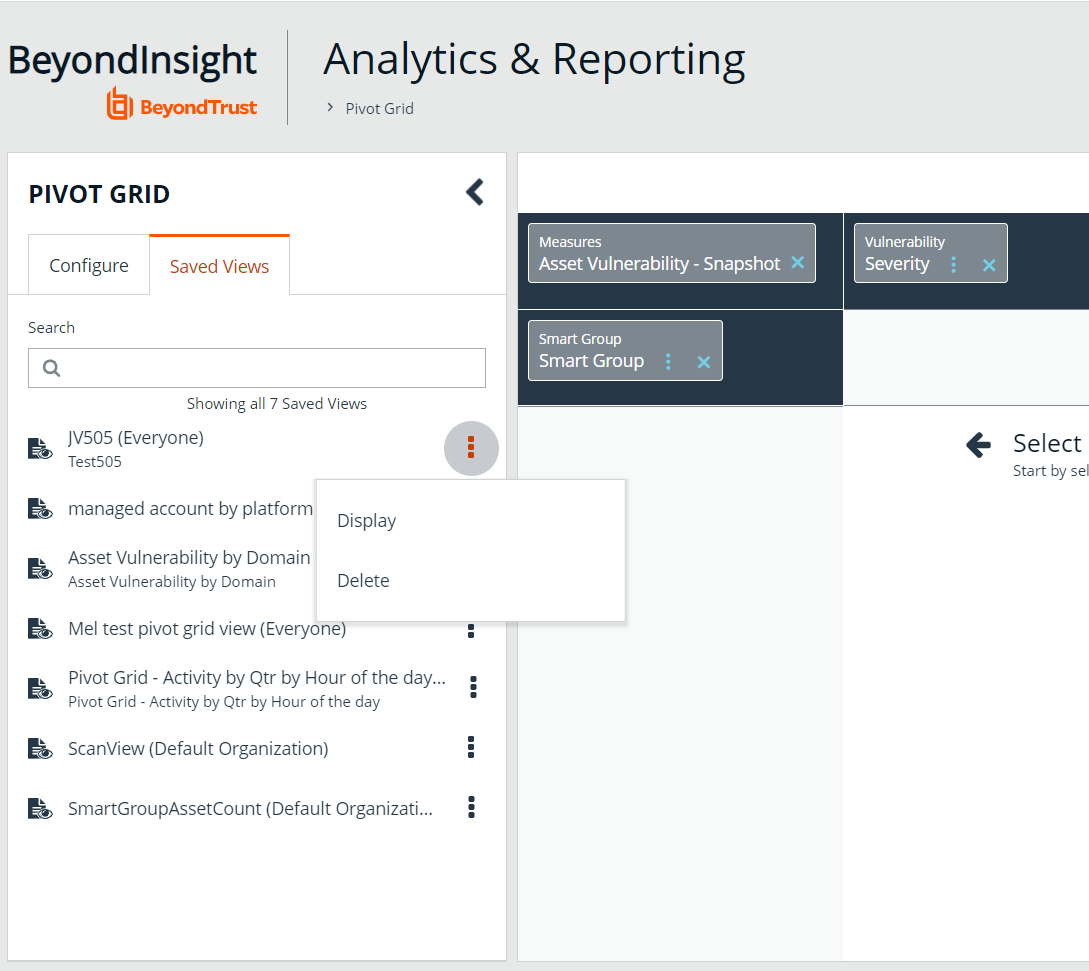
- Your saved view is now listed under Saved Views in the left panel. You can also search to find views that contain the keyword.
- To view most current information for that pivot grid, click the vertical ellipsis for the saved view, and then click Display. The data is retrieved from the cube each time you display the saved view.
- To delete the saved view:
- Click the vertical ellipsis button for the saved view, and then click Delete.
- Click Delete on the confirmation message.
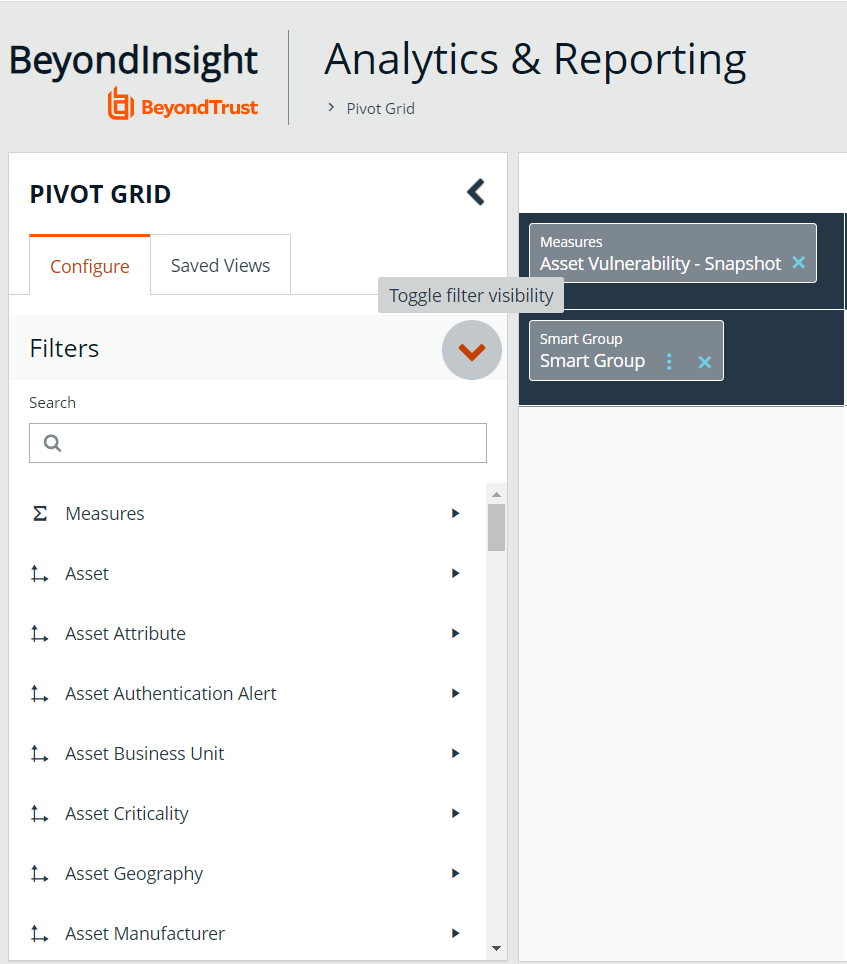
You can collapse and expand the Filters section of the Configure panel using the arrow toggle. Each time you open a saved view, the Filters section is either closed or open, depending on its state when it was saved.
Save data to a file
You can save the pivot grid data in JSON format and reload the data at a later time.
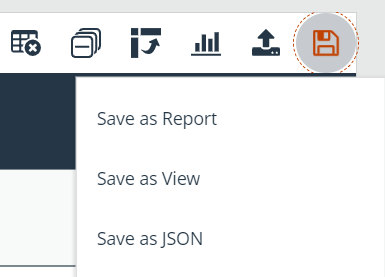
- In the toolbar, click Save, and then select Save as JSON.
- The file automatically saves to the default download location.
Import the JSON file
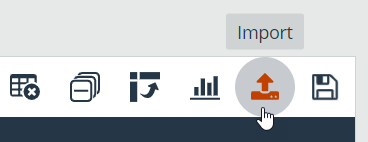
- In the toolbar, click Import.
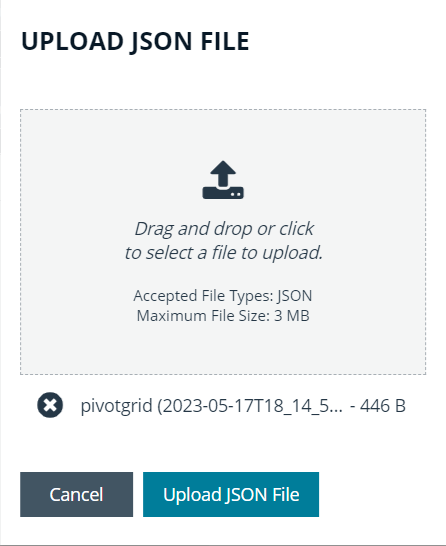
- Locate the JSON file from the download location and drag the file into the drop box. Alternatively, click within the drop box to open a file browser to navigate to the JSON file to upload it.
- Click Apply to Pivot Grid.
Display data as a chart
Once you have created a pivot grid, you can display the data as a chart.
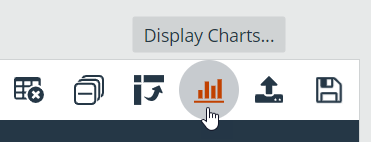
- To display the data as a chart, click Display Charts in the toolbar, and then select a chart type from the menu. The following chart types are available:
- Area
- Category
- Line
- Spline
- Spline Area
- Step Area
- Step Line
- Waterfall
- The chart displays showing data that is currently expanded in the pivot grid.
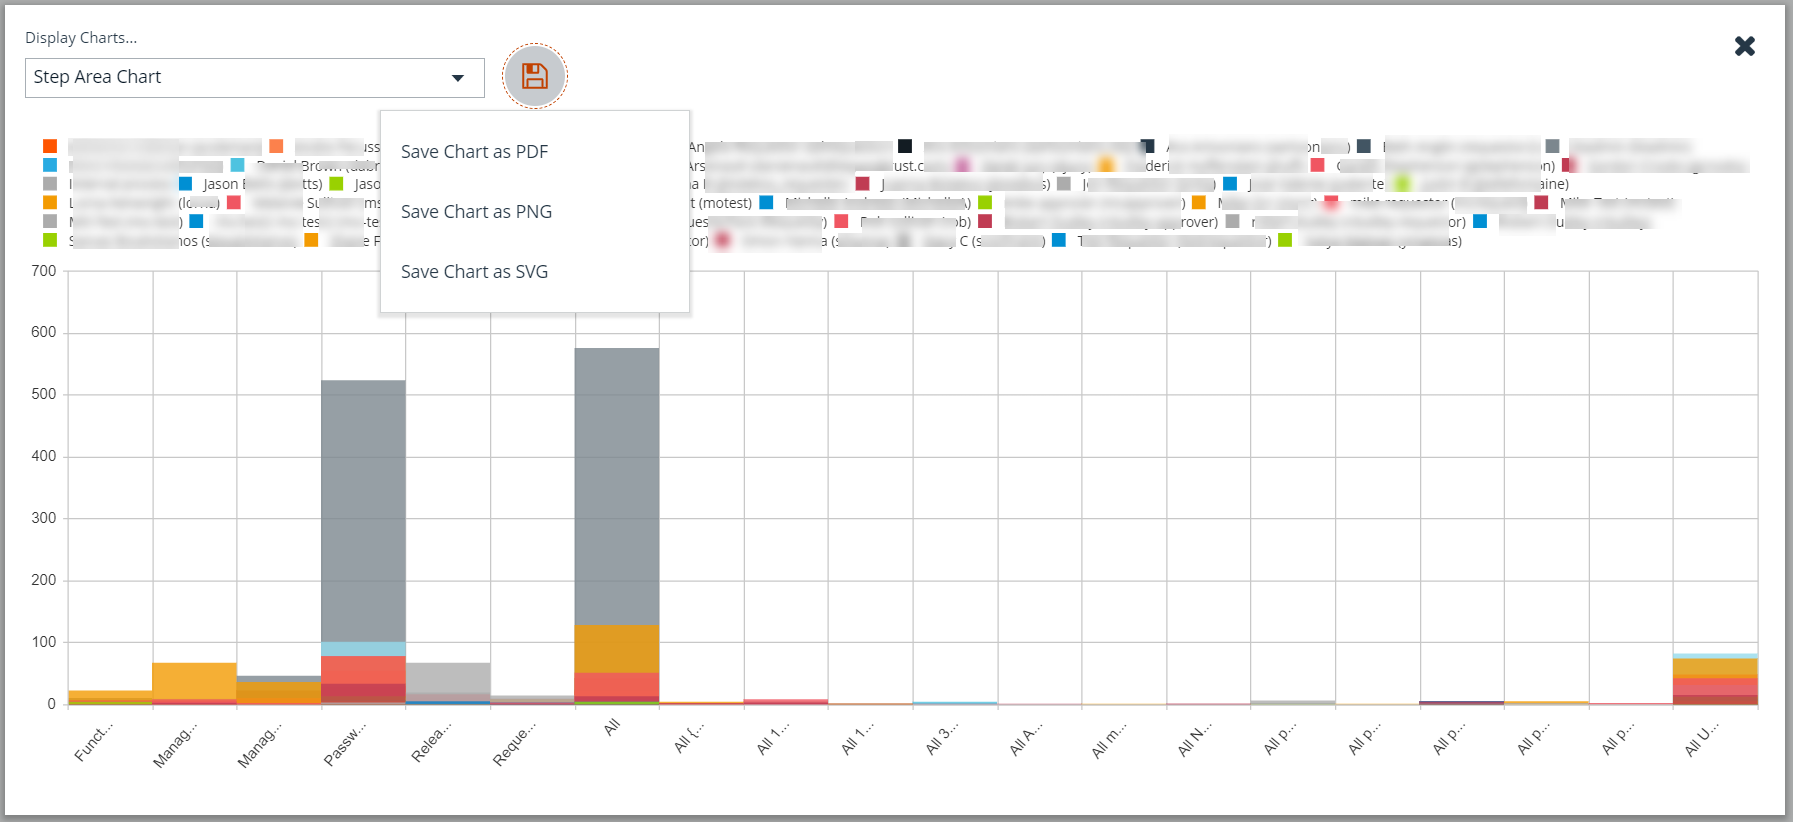
- Chart series data can be enabled or disabled by clicking the corresponding data in the legend above the chart.
If you save a pivot grid as a view while a chart is displayed, the chart is displayed each time the saved view is loaded.
- Click Save above the chart, and then select either Save Chart as PDF, Save Chart as PNG, or Save Chart as SVG.
- The file automatically saves to the default download location.
Create a custom report
Once you have created a pivot grid, you can save your selected filter, measure, and dimension fields to a custom report that you can then execute, subscribe to, or save as snapshots, just as you can with BeyondInsight in-built reports. Custom reports are saved under the Custom folder on the All Reports page.
If you make changes to the pivot grid layout, any saved custom reports will not update automatically.
Click on the custom report in navigation tree to run it or create subscriptions and snapshots.
Once you have created a pivot grid, you can create a report based on the fields selected in the grid.
- In the pivot grid toolbar, click Save > Save as Report.
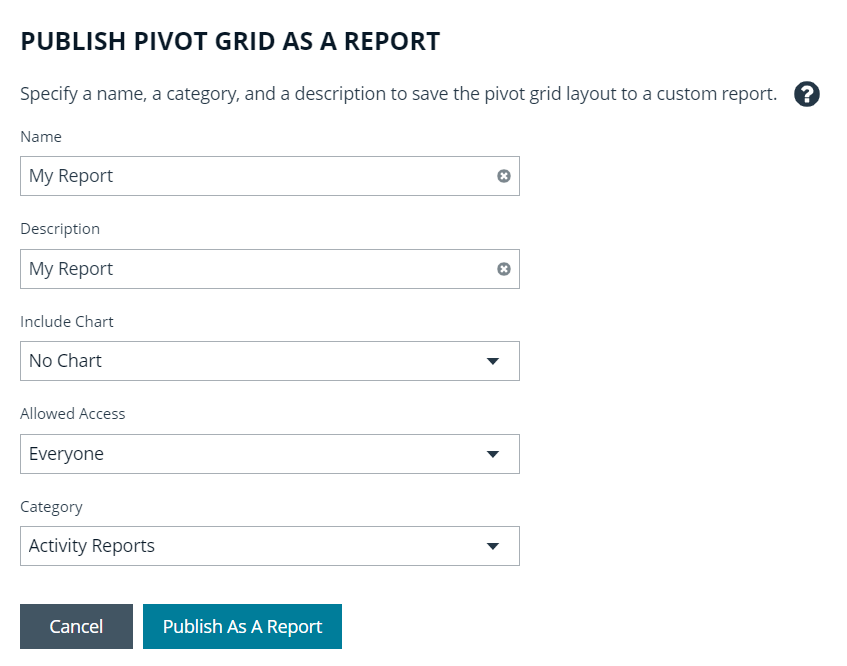
- Enter a name and description for the report. A name must be unique for the selected category.
- To attach or change the chart type, select one from the Include Chart dropdown.
- Select the appropriate group for Allowed Access.
- Optionally, select a Category. Categories are used to organize reports into folders.
- Click Publish as Report.
Example measures in the Asset cube
You can use the following table as a guide for commonly used measures in the Asset cube.
| To filter on… | Select this measure… |
|---|---|
| Inventory (rolling count) of discovered assets | Measures > Asset Discovery - Snapshot |
| Inventory (rolling count) of open ports on assets. Can be used to find which ports are open on which machines | Measures > Asset Port - Snapshot |
| Inventory (rolling count) of services on assets | Measures > Asset Service - Snapshot |
| Inventory (rolling count) or shares on assets | Measures > Asset Share - Snapshot |
| Inventory (rolling count) of software on assets | Measures > Asset Software - Snapshot |
| Inventory (rolling count) of local user accounts on assets | Measures > Asset User Account - Snapshot |
Sample Usage Scenarios
To see the count of assets:
- In Measure Fields, place Measures > Asset Discovery - Snapshot.
- In Row Fields, place Dimensions > Asset > Asset.Asset.
To see the count of user accounts on an asset:
- In Measure Fields, place Measures > Asset User Account - Snapshot.
- In Row Fields, place Dimensions > Asset User Account.
- In Column Fields, place Dimensions > Asset.Asset.