Configure BeyondInsight Analytics & Reporting in an On-Premises Deployment
For on-premises deployments of BeyondInsight, you can configure analysis, integration and reporting services, as well as manage agent jobs, report subscriptions and styling, and threshold ranges.
Configure Report Styles
You can customize the colors of the report, including chart colors, header and description components, and horizontal bar components. You can change the default image to your corporate logo, with a file type of PNG, JPEG, or BMP. The default size is 975x146 pixels.

- In the console, navigate to Configuration > Analytics & Reporting > Configuration.
- Enter administrative credentials.
- Click Report Styling.
- To change the report banner logo, drop an image file onto the box in the Report Logo section. You can also click inside the box to browse to the image.
- To change Report Colors or Chart Colors, click the square you want to change, select the new color, and then click the square again.
- You can click Discard Changes to reverse the most recent change.
- Once satisfied with the color and logo changes, click Save All Styling.
- To reset all changes to the default, click Restore to Default, then click Reset.
Manage SQL Server Agent Jobs
BeyondInsight uses a SQL Server agent job to retrieve data from sources and process the data into the analysis cube.
- In the console, navigate to Configuration > Analytics & Reporting > Configuration.
- Enter administrative credentials.
- Click SQL Server Agent Jobs.
- Select a job type from the left navigation: Process Daily, Process Full, or Process Full (OLAP only).
During normal operation, you do not need to manually start the Process Daily job. The job is designed to run automatically each day during off-peak hours. However, the job can be started from SQL Agent Jobs > Analytics & Reporting.
For SQL Analysis Services, the Server mode must be set to Multidimensional. Please refer to Microsoft documentation on how to set or change the SSAS mode.
Running a Process Full job erases all historical data and refreshes the Analytics & Reporting database with only active data from the management console. This job should not be run under normal circumstances.
- Review the status showing the result of the last run. Expand a job to show the job history and diagnose issues that may prevent the job from running.
- Click Download logs to save diagnostic information and job history details in a zip file.
- Click Refresh to update the view.
Configure Clarity Analytics
To work with BeyondInsight Clarity, you must configure settings in the BeyondInsight management console.
Configure the Analytics Calculation
- In the console, click Configuration.
- Under Analytics & Reporting, click Clarity Analytics.
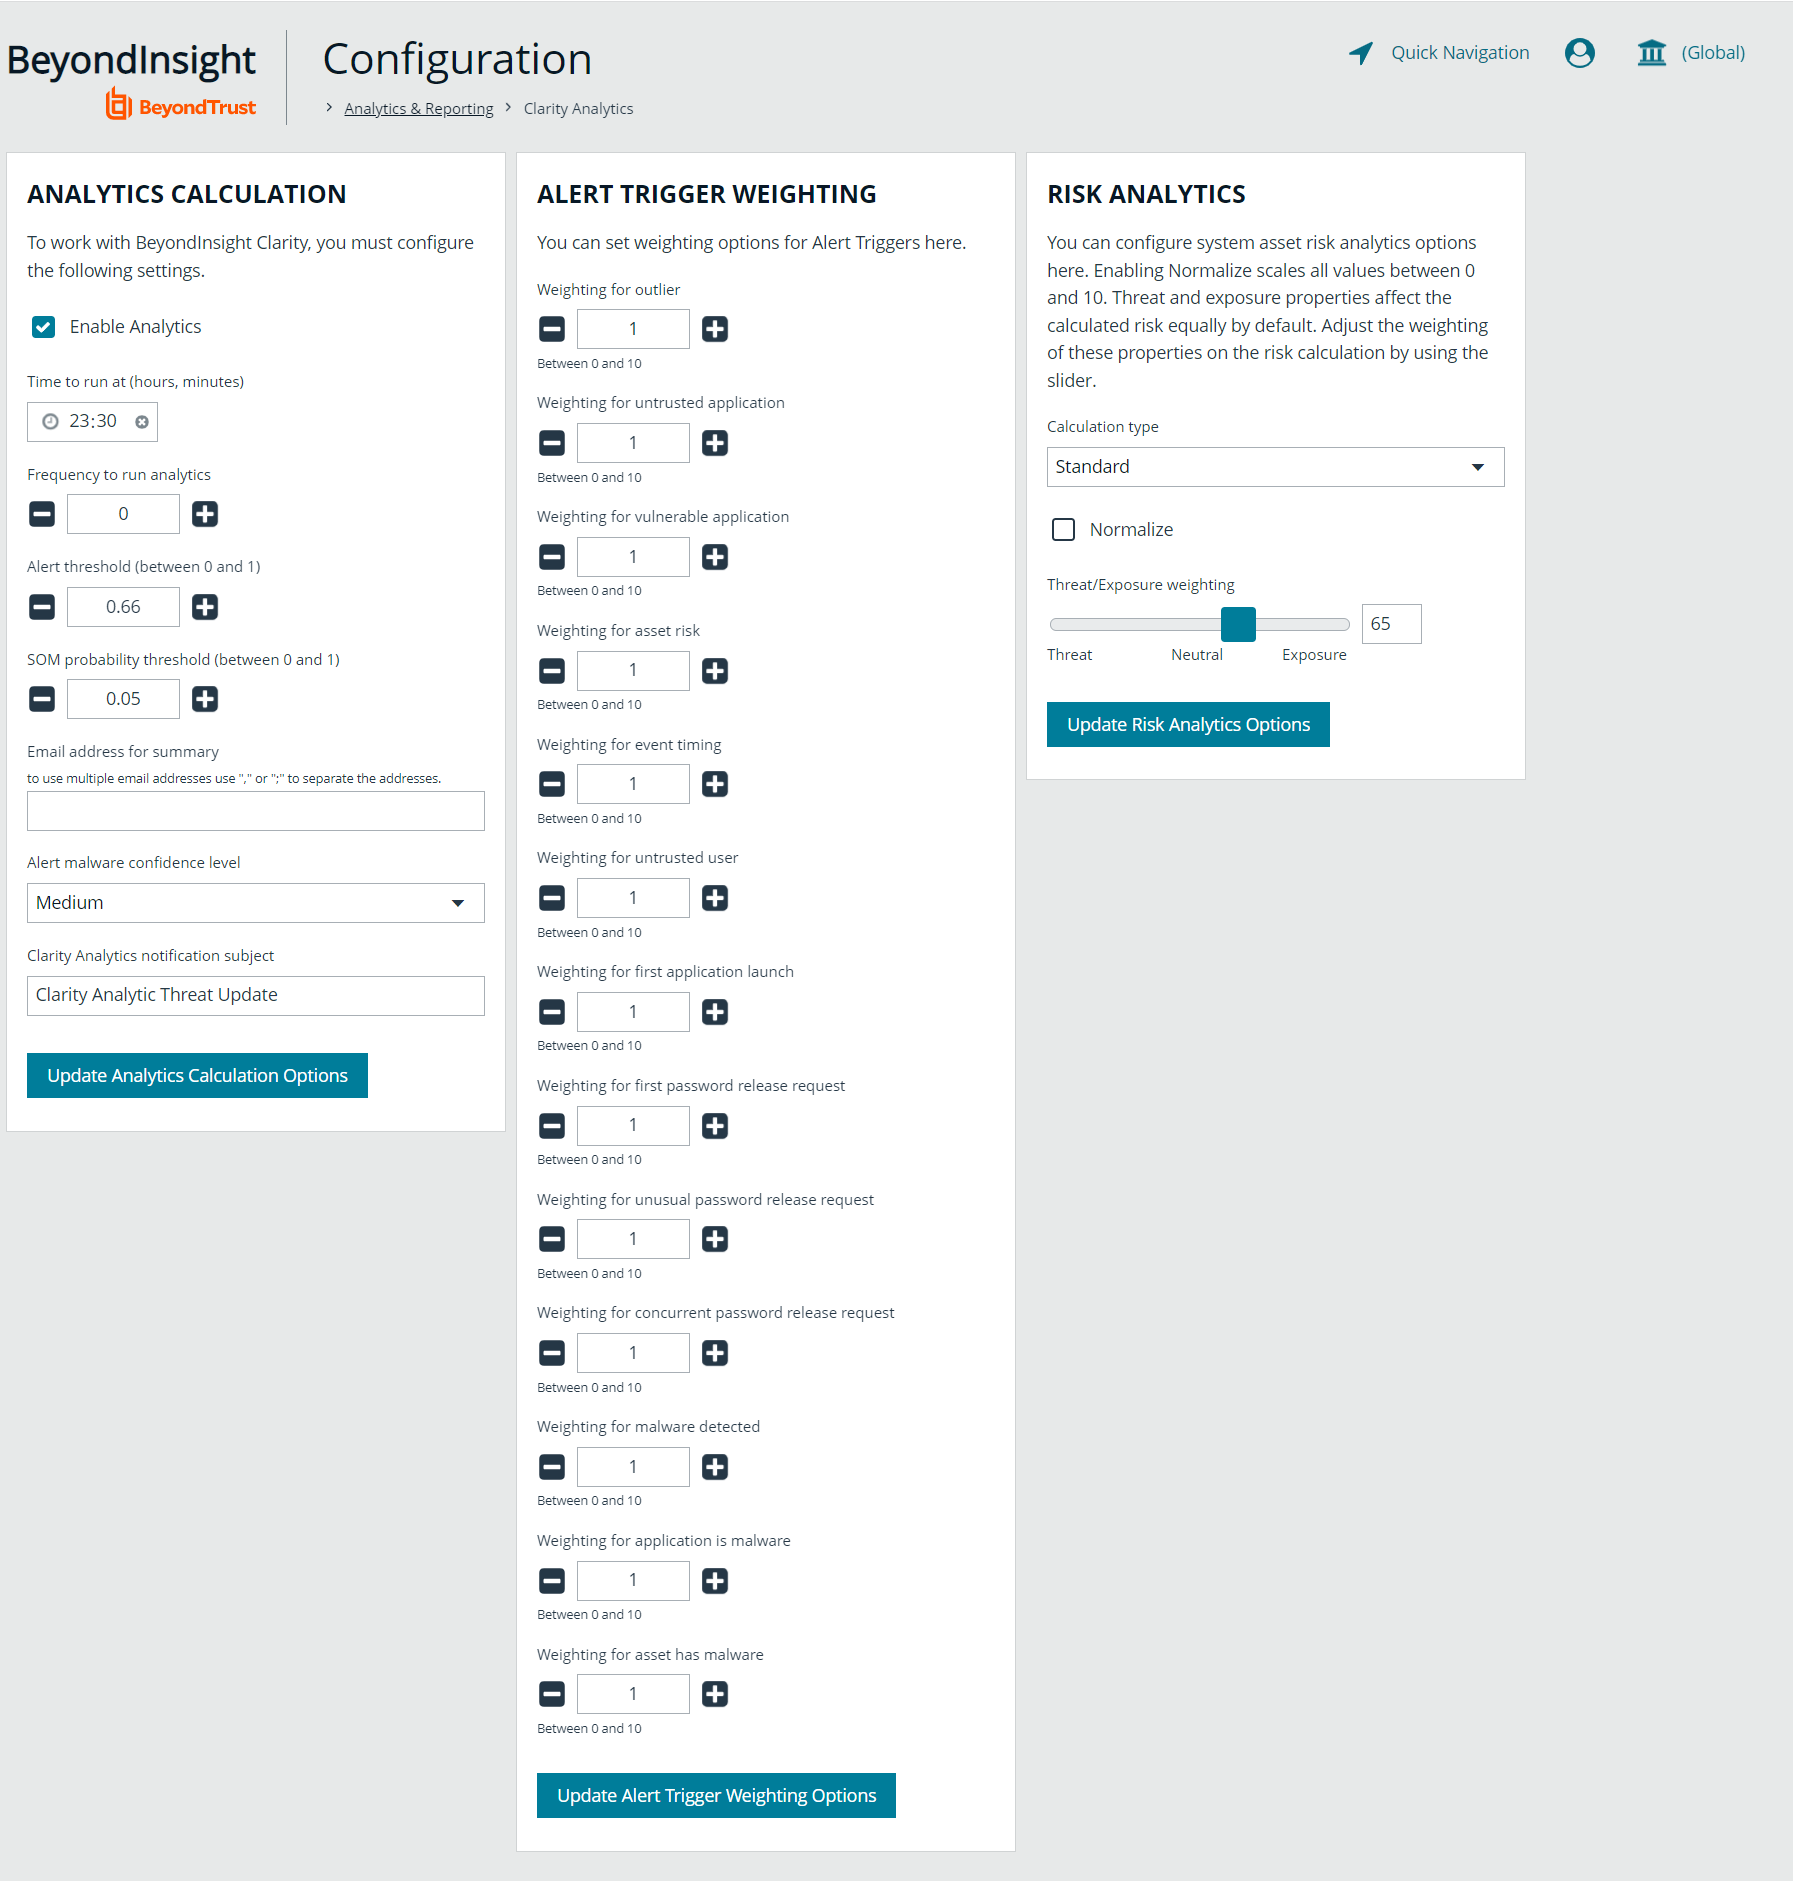
- From the Analytics Calculation section, you can:
- Enable and disable analytics.
- Select the hours and minutes for Time to run at.
- Select the frequency for running analysis.
- Set the Alert Threshold for flagging explicit alerts. The higher the value, the higher the sensitivity and the fewer flagged alerts. The range is from 0 to 1. The default value is 0.65.
- Set the Som Probablity Threshold for flagging pattern alerts. The lower the value, the higher the sensitivity and the fewer flagged alerts. The range is from 0 to 1. The default value is 0.05.
- Enter an email address to send notifications to.
- Set the notification subject.
- Click Update Analytics Calculation Options.
Set Alert Trigger Weighing
From the Alert Trigger Weighing section, you can configure Clarity to prioritize or weigh specific alerts. If an alert with a higher weight is triggered, the alert appears more prominently in the Clarity analysis. This allows you to quickly see and react to critical alerts.
To configure a weight for an alert, click the minus and plus buttons to modify its numeric value, ranging from 0 to 10. When you are satisfied with your selections, click Update Alert Triggering Weighing Options to finalize.
Configure Risk Analytics
Using the risk analytics values, you can focus the results data on the highest risk assets.
Enabling Normalize scales all values between 0 and 10. When you choose to normalize the data, the asset at the highest risk is assigned the highest rating. All other assets are rated and organized below the highest risk asset. Normalizing the results provides a way to distribute the assets in a more meaningful way to analyze the data.
Threat and exposure properties affect the calculated risk equally by default. Adjust the weighting of these properties on the risk calculation by using the slider. You can change the results to emphasize risk levels based on exposures or threats. For example, if you move the slider to Exposure, asset exposure risk factors are given greater weighting in the final risk calculation and increase an asset's risk score.