Parse Endpoint Privilege Management Events in Splunk
You can parse Endpoint Privilege Management events in Splunk to create custom reports and dashboards.
You can substitute Avecto Defendpoint Service with Avecto Privilege Guard Service where applicable for older versions of the product.
- On the Splunk server, navigate to C:\Program Files\Splunk\etc\system\local and open the props.conf. If the file does not exist, you can create it.
- Add the following lines:
[Wineventlog:Application]
SourceName = "Avecto Defendpoint Service"
REPORT-fields = wineventlog_parser
- In the same directory, open the transforms.conf file for editing. If the file does not exist, you can create it.
[wineventlog_parser]
SourceName = "Avecto Defendpoint Service"
REGEX = (?m)^\s+([^:\n\r]+):\s([^\n\r]+)
FORMAT = $1::$2
MV_ADD = true
- Restart the Splunk server from the Settings menu. Go to System > Server Controls, and then click Restart Splunk.
- On the Search page, search for SourceName = "Avecto Defendpoint Service" in the index. For example:
index="dp_events" SourceName="Avecto Defendpoint Service"
In the event that you use an alternate log location, the event log name and source name should be BeyondTrust Privilege Management.
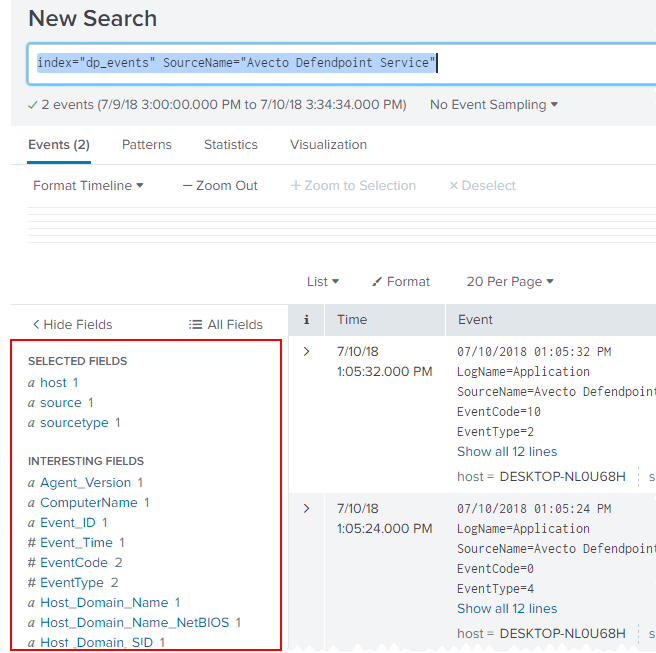
- The parsed fields are displayed on the left of the search.
- On the search page you can build the search query using fields such as:
index="dp_events" SourceName="Avecto Defendpoint Service"|table Application_Group,ComputerName,LogName,EventCode,Keywords,Command_Line,File_Name,Description,Process_Id,Parent_Process_Id,Workstyle,Sid,SidType,RecordNumber,Hash,Certificate|search EventCode!=0 AND EventCode!=10
- The table is displayed with a header for each attribute you specified in your query. You may need to change the time filter on the right to see all the events.
Parsing the events this way only works when the search is made with the index.