Manage SIEM Connections
You can set up SIEM connections to integrate with Endpoint Privilege Management for Unix and Linux (EPM-UL) and AD Bridge events. The available connection types are Elasticsearch and Logstash.
You can have only one Elasticsearch type connection.
For information on configuring a SIEM connection for use with an EPM-UL server, see Configure SIEM for Use With an Endpoint Privilege Management for Unix and Linux Server.
Add a SIEM Connection
- On the sidebar menu, click Settings > SIEM Connections.
- In the SIEM Connections left panel, click Add Connection.
- On the Create New SIEM Connection page, select the SIEM connection type.
- In the SIEM Connection Details section, enter a name and URL for the connection.
- Optionally, check the box to verify the certificate for the connection. You can use this option in the case of unknown signer, for example, if a self-signed certificate is in use.
For an Elasticsearch connection type:
- In the Elasticsearch Connection Details section, select a credential type from the list: Username and Password or API Key.
- Depending on the credential type you select, enter the following:
- Username and Password
- API ID and API Key
- Cloud ID
- You can leave the Optional Search Index Patterns Overrides section fields as is, because there are default pattern values. Optionally, enter the following:
- EPM-UL Index Patterns
- EPM-UL Session Replay Index Patterns
- AD Bridge Index Patterns
- Proceed to the "To complete the process for either connection type" section (after the Logstash section, next).
- Directly specifying the URL of the Elasticsearch instance. This method specifies the location of Elasticsearch but contains no information about the location of Kibana.
- Providing a CloudID identifying the Elasticsearch instance. This method encodes the locations of both Elasticsearch and Kibana. Only connections using CloudID can identify the location to deploy the Kibana dashboard.
For a Logstash connection type:
- Click the Information icon (next to Logstash Connection Details) to see sample configuration examples, and additional pipelines information
- In the Logstash Connection Details section, enter a Username and Password.
To complete the process for either connection type:
- In the BeyondInsight for Unix & Linux Logging section, select the logging option(s), to send BIUL Console Audit Data, System Logs, or Task Logs to the SIEM. When enabled, data that is regularly stored in the local log file or BIUL database is additionally forwarded to the elastic connection. This data is in the elastic common schema format. The data is then available via a grid in the Audit > Unified Search > BeyondInsight for Unix & Linux section.
- Optionally, to test your updated settings and connection, click Test Settings, and check for the success message.
- Click Save SIEM Connection.
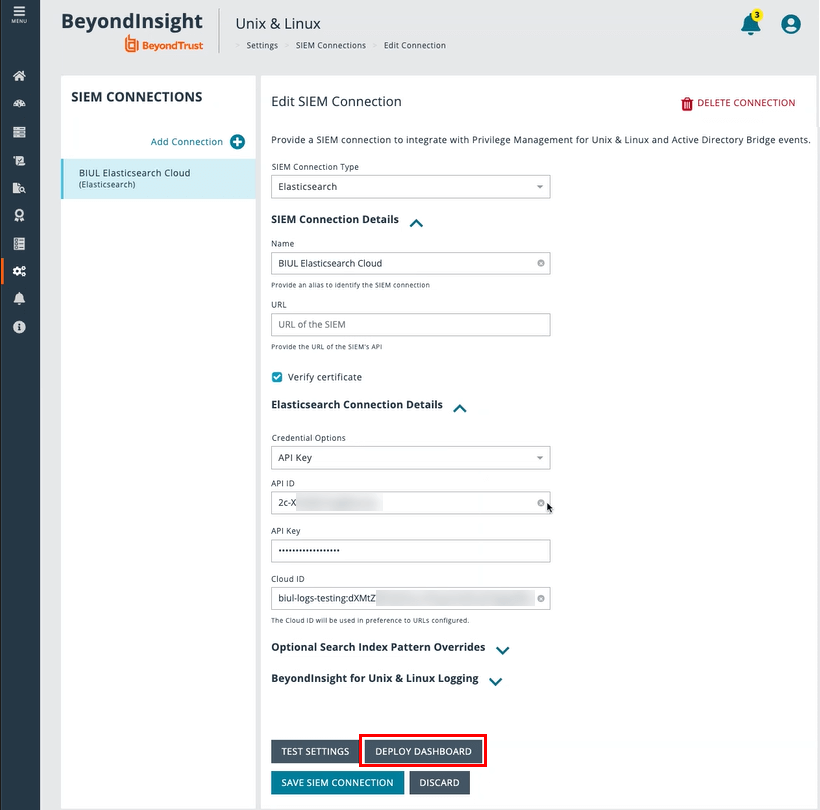
Edit a SIEM Connection
You can change the settings for an existing SIEM connection.
- On the sidebar menu, click Settings > SIEM Connections.
- In the SIEM Connections list, select a connection.
- On the Edit SIEM Connection page, make your modifications, and then click Save SIEM Connection.
- Optionally, to test your updated settings and connection, click Test Settings.
Deploy a Kibana Dashboard
Connections using CloudID can identify the location to deploy the Kibana dashboard.
To deploy a Kibana dashboard, you must:
- Configure Elasticsearch in BIUL.
- Associate a Kibana instance with the Elasticsearch instance.
- Connect to your Elasticsearch instance using a CloudID.
To deploy a Kibana dashboard using BIUL:
- On the sidebar menu, click Settings > SIEM Connections.
- In the SIEM Connections list, select your Elasticsearch connection.
- On the Edit SIEM Connection page, click to open the Elasticsearch Connection Details.
- Click Deploy Dashboard.
- The Kibana Dashboard URL appears.
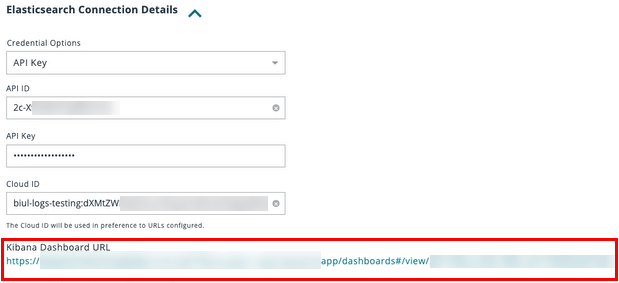
- Click the link to access the Kibana dashboard.
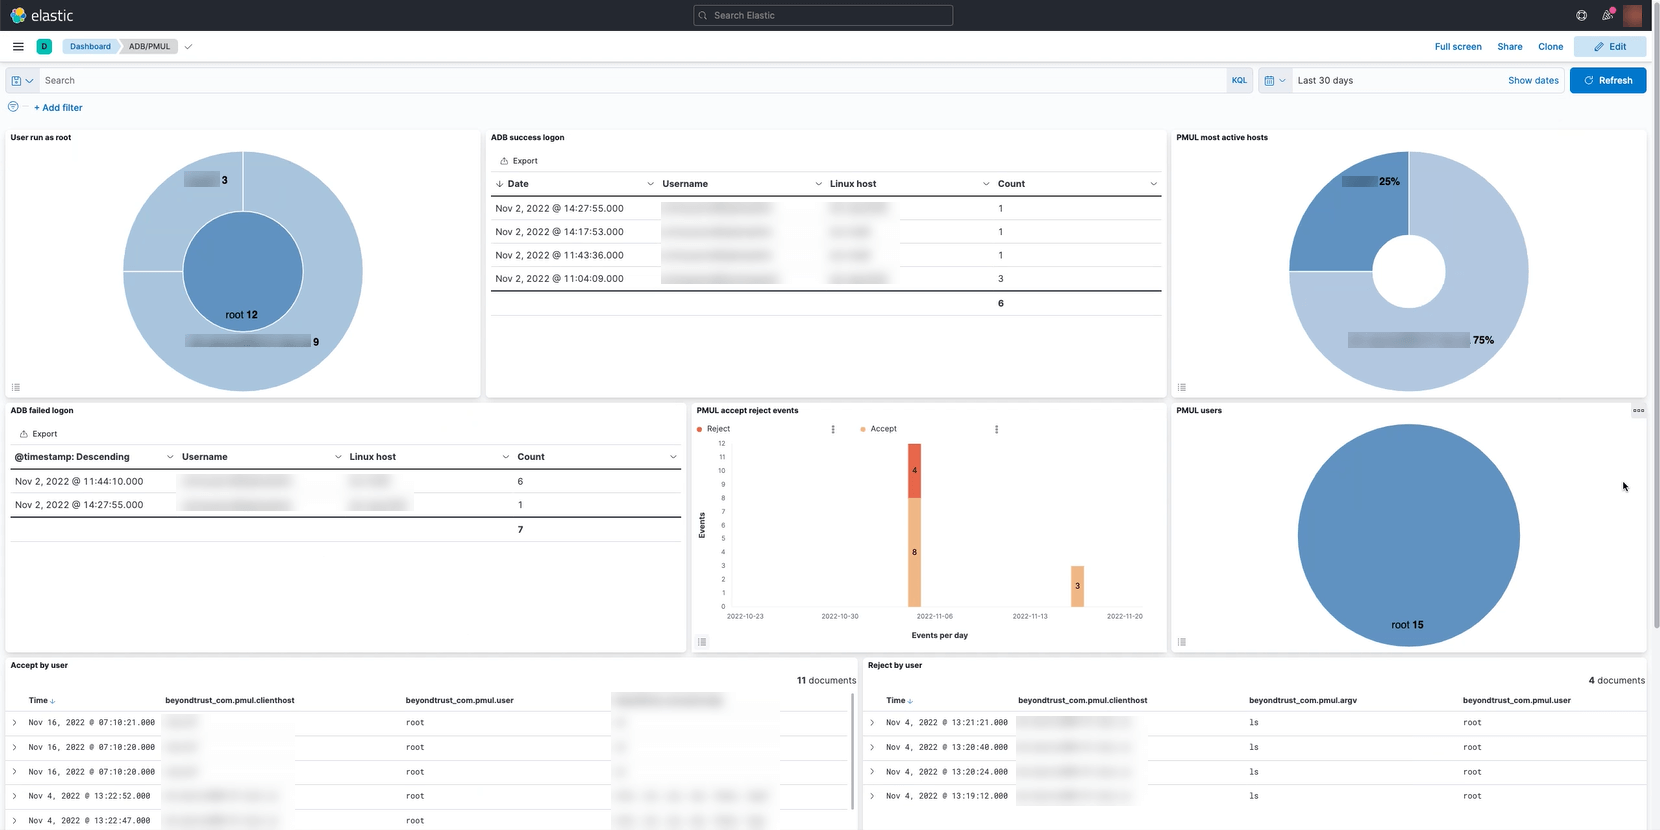
This is a prebuilt Kibana dashboard layout defined by BeyondTrust. The dashboard provides a few visualizations relevant to BeyondTrust products, including AD Bridge authentication events and EPM-UL policy events.
Delete a SIEM Connection
To delete an existing SIEM connection:
- On the sidebar menu, click Settings > SIEM Connections.
- In the SIEM Connections list, select a connection.
- On the Edit SIEM Connection page, at the far right, click Delete Connection.
- To confirm the deletion, click Delete.