Audit Activity Using BIUL
From the Audit page, you can access:
- Unified Search: Search for Endpoint Privilege Management for Unix and Linux(EPM-UL), Active Directory Bridge (AD Bridge), and BeyondInsight for Unix & Linux (BIUL) events
- PMUL Events: View and download EPM-UL event logs
- Console Audit: View activity within the EPM-UL console
- Session Replay: View, replay, and audit EPM-UL session replays
- As of EPM-UL version 10.3, event log information is retrieved from databases. Previous versions of EPM-UL support log files.
- A minimum version of EPM-UL 10.0 is required to view log contents. In earlier versions, the log must be downloaded to view.
Perform a Unified Search
The unified search gathers log files from EPM-UL, Active Directory Bridge (AD Bridge), and BIUL. You can then search from a single line for EPM-UL, AD Bridge, and BIUL events, simultaneously.
Currently, Elasticsearch is the only supported SIEM. This section will only be available if there is a configured and working connection to Elasticsearch.
To perform a search:
- From the sidebar menu, select Audit > Unified Search.
- Enter a search query to display the list of events. Search options include:
- Fuzzy / partials matches: Default. Searching for tree, for example, returns results with tree and pinetree.
- Exact matches: Use double quotes. Searching for “sudo”, for example, and results only contain sudo.
- Logical AND: Results must have both values, as in sudo AND emacs.
- Logical OR: Results may contain either value, as in sudo OR emacs.
- Logical NOT: Results will exclude value, as in sudo NOT visudo.
- Operator precedence: Using brackets, as in (sudo AND emacs) or (sudo AND vi).
- Date and time options: Use these to set ranges, including some defaults, and the ability to set begin and end times.
When writing your query, you do not need to capitalize the logical operators (and, or, not).
- Click Search.
You can also just click Search, without entering any criteria. Unified Search has default criteria that return all available events.
- To view the results, click the Endpoint Privilege Management for Unix and Linux, AD Bridge, or BeyondInsight for Unix & Linux button. Click to toggle a selection on or off. The result count appears at the bottom right of the grid (as number of items). At the bottom of the grid, you can also find the page count, along with the page navigation icons.
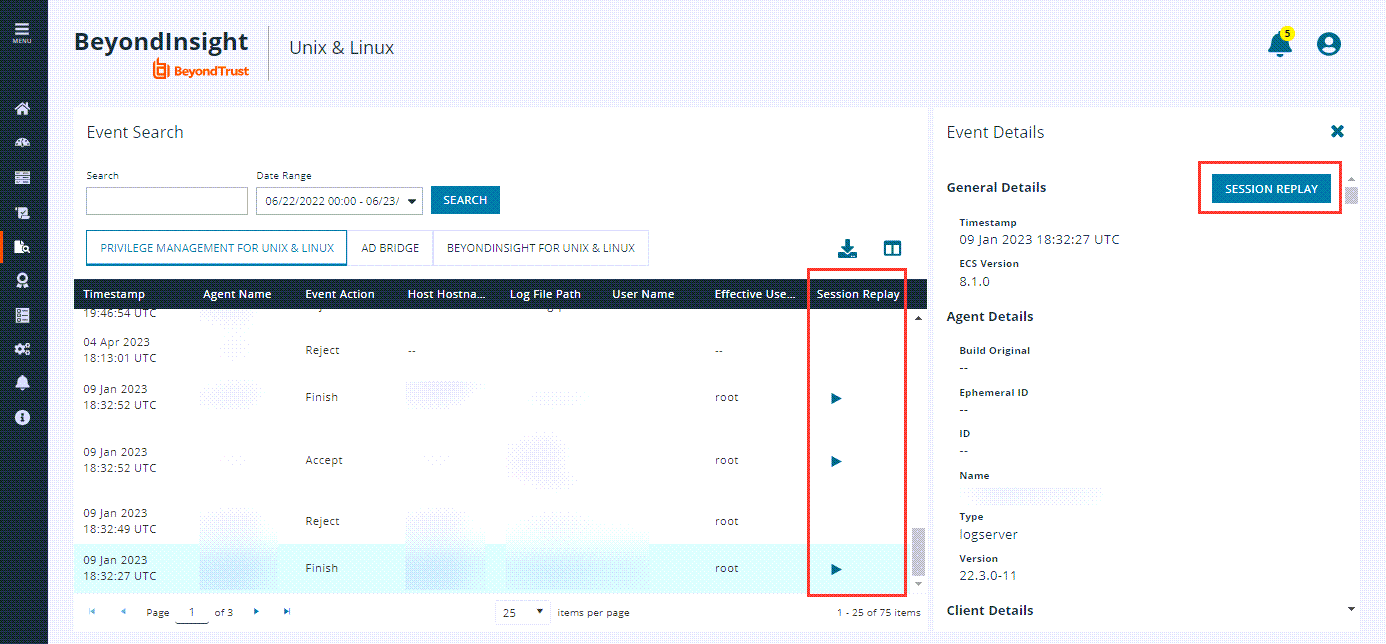
- For full event details, click on a row. The Event Details panel displays on the right.
When you choose which event search columns to display in the grid, select the Session Replay option (see below). This way, when looking at the events list, you see an icon in the column that indicates that a recorded session exists. When you open the Event Details panel, you see the Session Replay button.
Replay Sessions from the Events Details Panel
Events that are associated with IO Logs provide links to the Session Replay player. To play the file, in the Events Details panel, click the Session Replay button. Optionally, you can enter a Comment and set the Audit Status, and then click Save.
For more information, see Replay Sessions in BIUL.
Choose Event Search Columns to Display
You can choose which columns to display in the grid.
To select which columns to display, at the top-right of the grid, click the Choose Columns to Display icon and select one or more columns to display.
The columns appear from left to right in the grid, in the order that you select them.
Download the Results Data
You can download the results data as a JSON or CSV file. To download a results file:
- After you perform a search, click the Endpoint Privilege Management for Unix and Linux, AD Bridge, or BeyondInsight for Unix & Linux results button. Click to toggle a selection on or off.
- At the right, click the Download icon, and then select JSON File or CSV File. The file downloads to your Download folder.
View EPM-UL Events
- From the sidebar menu, select Audit > PMUL Events.
- Find the host name in the list. Use the Hostname, IP Address, and Tags filters to refine the list of results displayed.
- At the far right of the server entry row, click the arrow.
- On the Event Log page, click the Event Source dropdown menu and select the log you want to view.
- For full event details, click on a row. The Event Details panel is displayed on the right. Use the Filter event keys field to refine the list of results displayed.
- To close the Event Details panel, click the X icon.
View Console Audit Activities
You can view user session information, such as user name, user ID, timestamp, user roles, and request URL.
- From the sidebar menu, select Audit > Console Audit.
- On the Console Audit page, use the filters to refine the list of user sessions displayed.
- At the far right of the session row, click the arrow.
- On the Session Details page, view more information, such as user name, user roles, HTTP method, and URL. Use the filters at the top of the columns to refine the list of results displayed.
- For full event details, click on a row. The Request Details panel is displayed on the right.
- To close the Request Details panel, click the X icon.