Manage U-Series Appliance Health
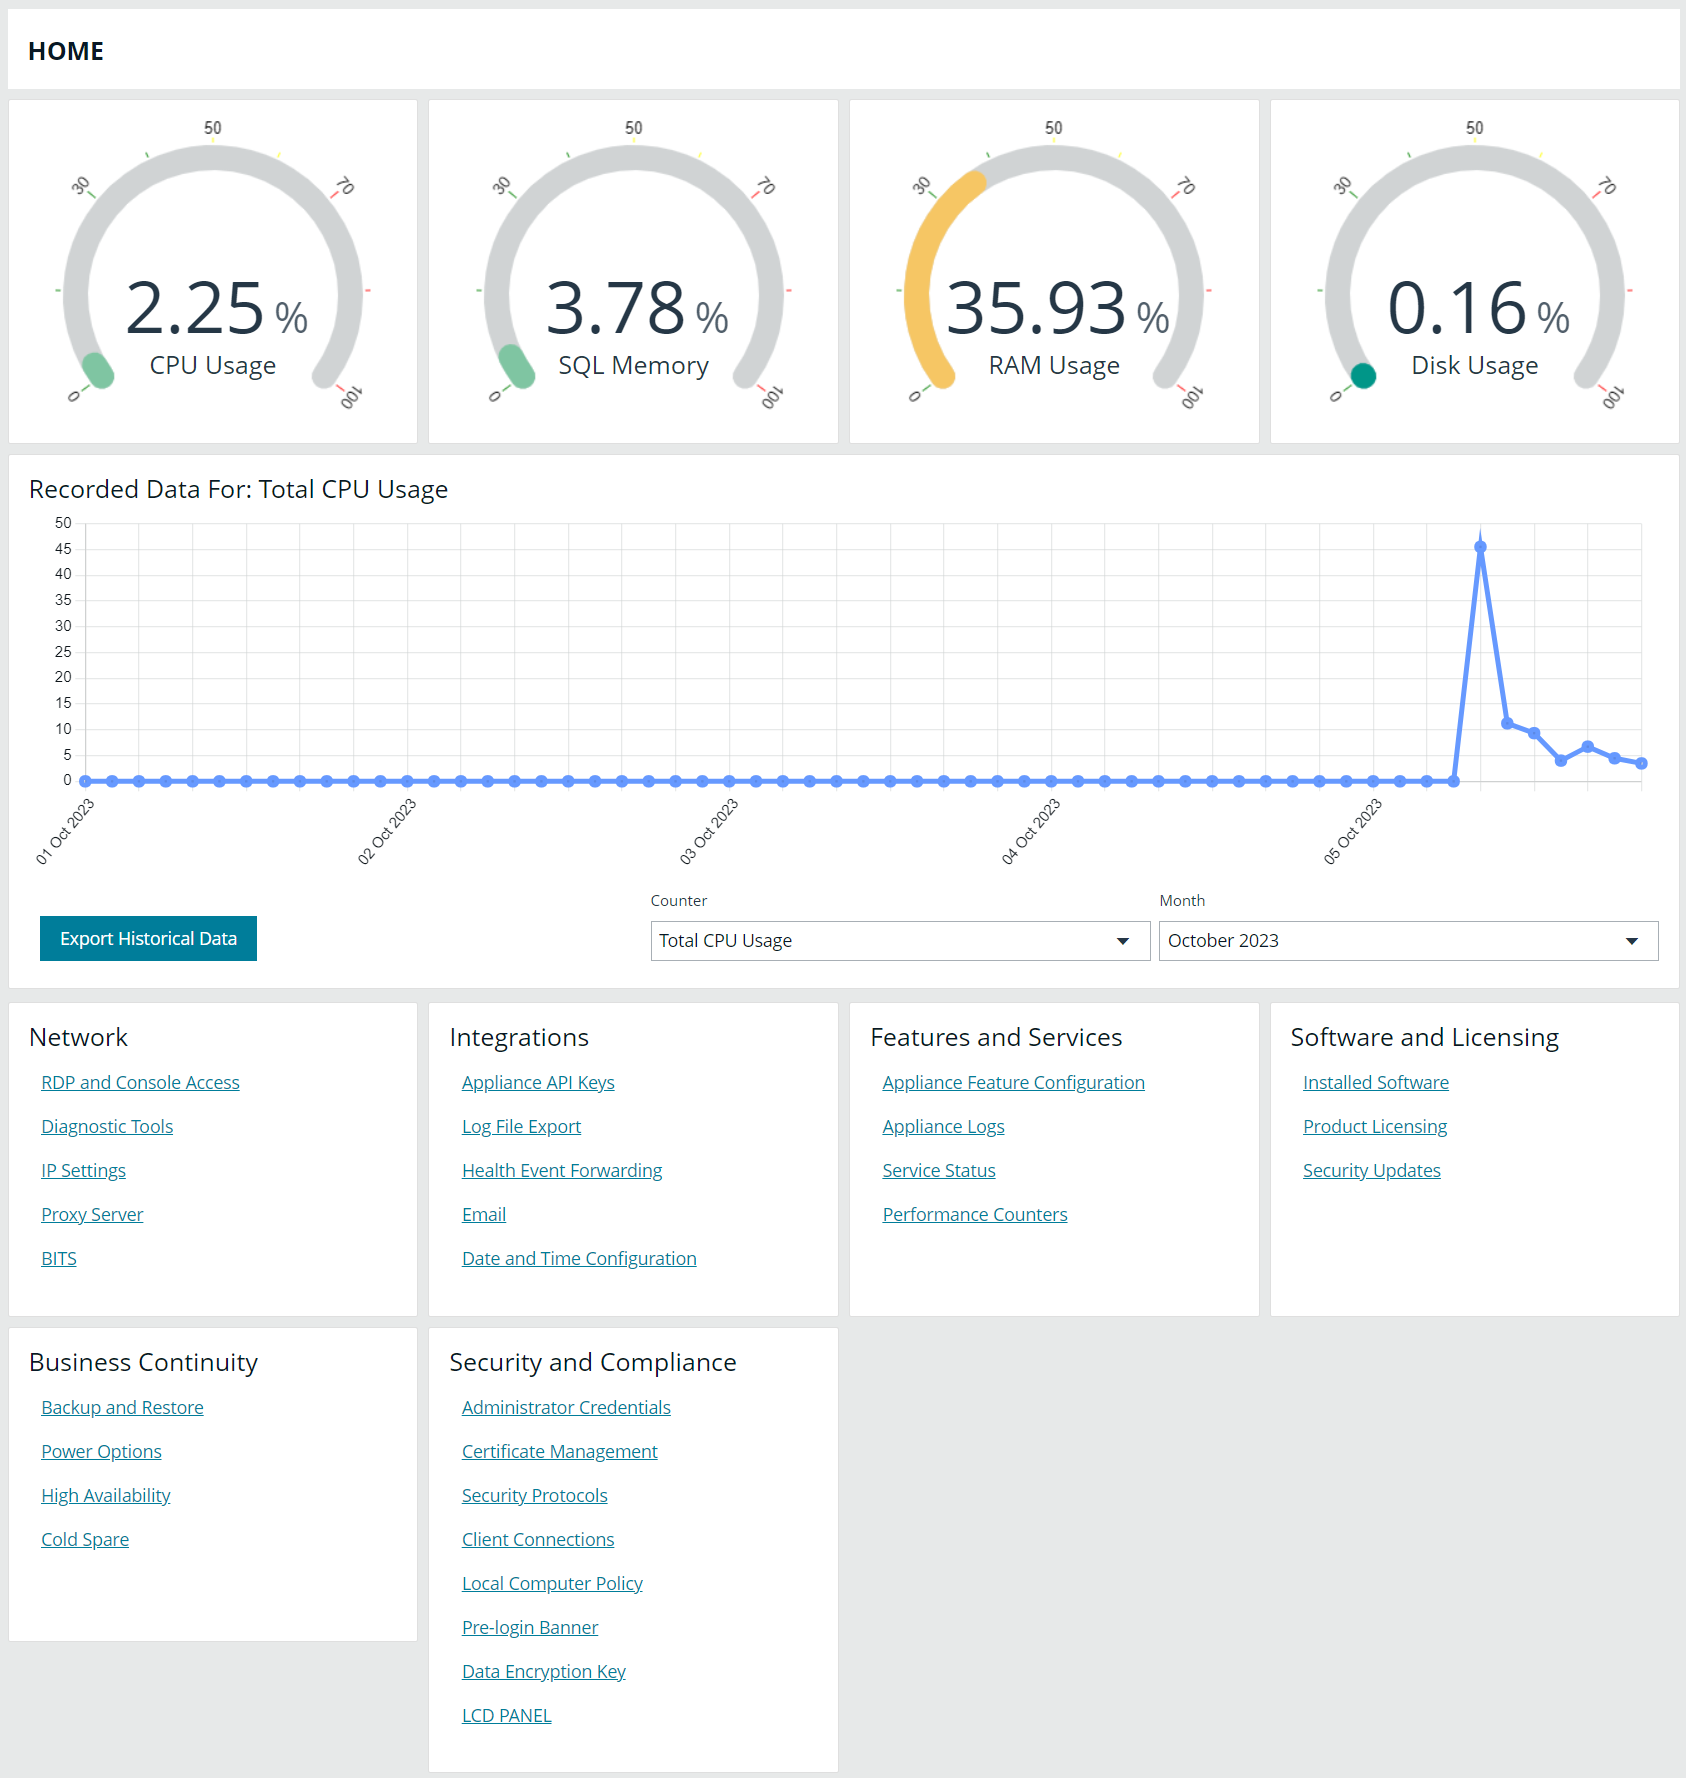
From the Home page, you can view a dashboard to help you understand performance metrics, and keep track of services and hardware faults, for your U-Series Appliance. You can also view and export historical data and access links to navigate to other configuration areas in your appliance.
Monitor the Health Dashboard
View dynamic, real-time U-Series Appliance metrics, including:
- CPU usage
- SQL Server memory usage
- RAM usage
- SQL Server CPU usage
- Used disk space on the C: drive
You can also view recorded data by month by using the Counter and Month dropdown lists. You can view data for:
- Total CPU Usage
- SQL Memory Usage
- SQL CPU Usage Percentage
- Disk Free Percentage (C Drive)
- RAM Usage
To download the above information, click the Export Historical Data button.
View health metrics on BeyondTrust components and services running in your environment.
If you use your own SQL Server deployment rather than the SQL Server version that ships with the U-Series Appliance, then the SQL Server metrics are not displayed on the health dashboard.
Monitor Services and Hardware
The U-Series Appliance periodically checks the running state of the services to make sure that they are in the expected state, considering the current features that are set. Additionally, alerts can be triggered when the service control manager raises errors, such as when a service fails to start or terminates unexpectedly.
The U-Series Appliance also monitors the hardware. Alerts can be triggered when an error is raised by Dell OpenManage monitoring software.
Enable Service Alerts
Turning service alerts on determines whether or not to generate alerts that might be emailed to an administrator or forwarded to BeyondInsight. Enable service alerts as follows:
- From the left menu, under Features and Services, click Service Status.
- Toggle the Generate Service Alerts switch to ON.
Check Services
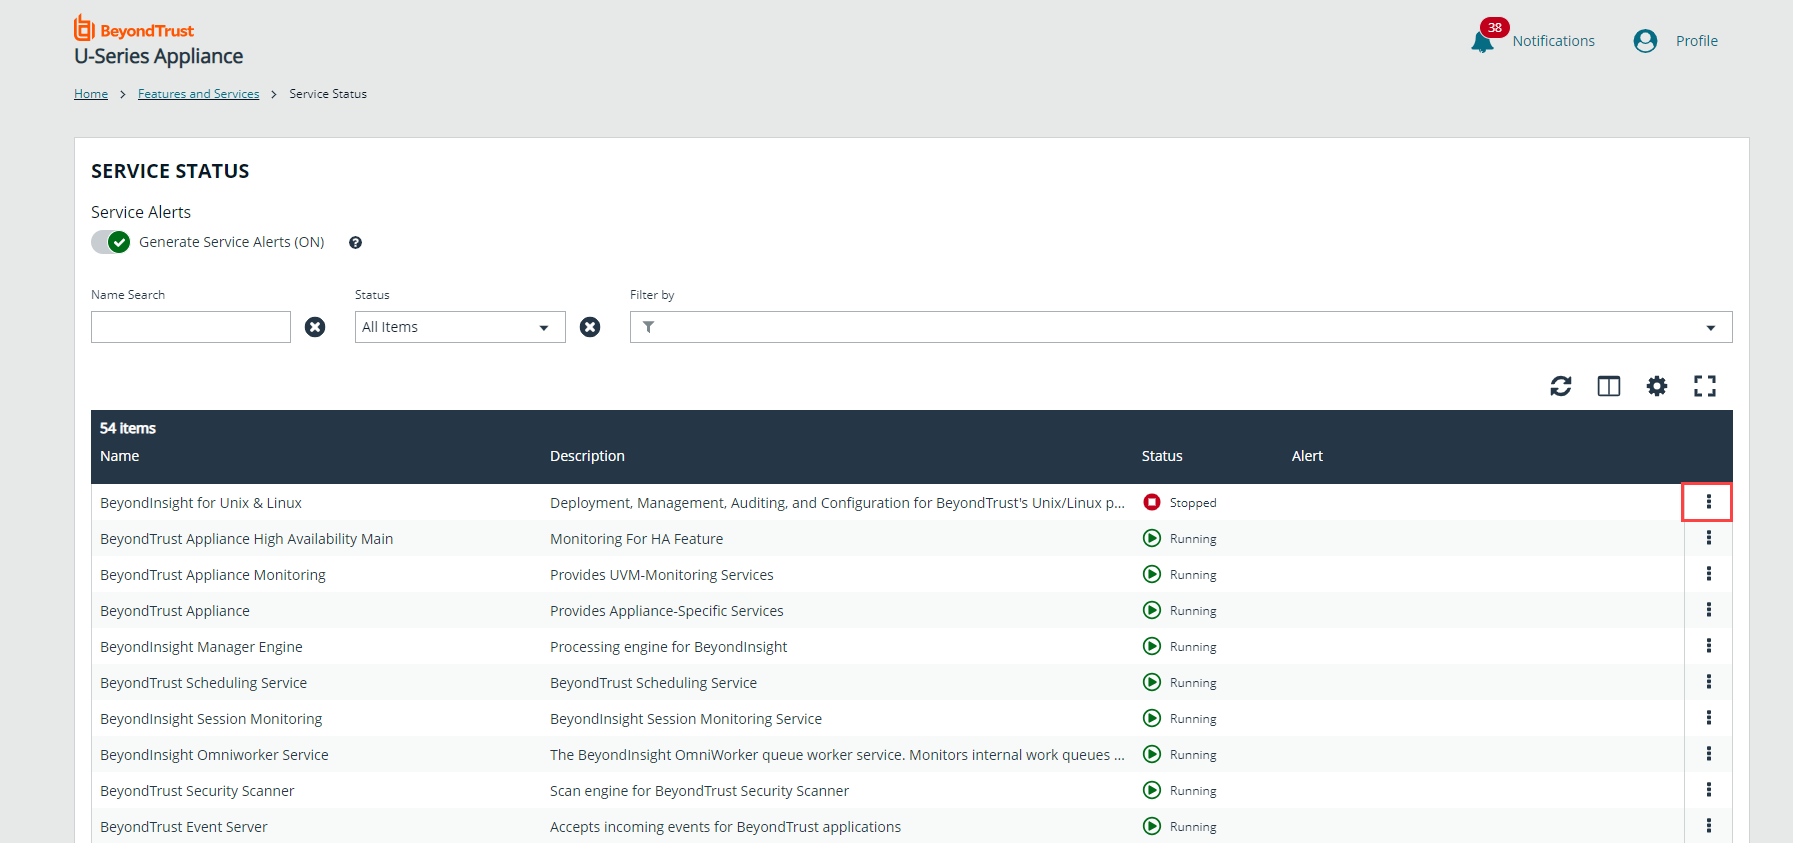
You can manage U-Series Appliance services, as follows:
- From the left menu, under Features and Services, click Service Status.
- Click the vertical ellipsis to the right of the service:
- Select Start to start a stopped service
- Select Stop or Restart to restart a running service.
Configure Counters for Performance Metrics
You can configure the threshold values for performance metrics. When the threshold is exceeded, email alerts are sent to the email accounts configured on the Configure Notifications page.
For example, you might not want CPU usage over 50% for too long. In this case, you might set the thresholds to:
- Low: 50
- Medium: 65
- High: 70
- Threshold Duration: 10 minutes
If the running average reads at 52%, then a low level alert is sent.
After a counter alerts at a certain level, it does not generate further alerts for that level (or below) until it is reset. An alert is considered in a reset state when the average is below the reset threshold for the specified time span.
If a metric in an alerted state goes below the configured reset threshold for the specified time, the alert is cleared, and a reset alert is generated. At this point, the performance counter receives alerts if it exceeds the threshold again.
- From the left menu, under Features and Services, click Performance Counters.
- Select notification settings:
- Generate Alerts When The Average Value Of A Counter Exceeds Its Configured Threshold: Turns on email notification for alerts.
- Generate Daily Summaries of Performance Data For Base Counters: Collects performance metrics every two hours and emails them on a daily basis.
- By default, the following five base counters are enabled. You may enable additional counters by checking the box next to the counter:
- CPU Overall Usage
- RAM Usage
- SQL Server CPU Usage
- SQL Server Memory %
- Disk % Used
- Adjust the performance and reset thresholds.
- Click Apply Settings.
Configure Notifications
You can set notifications for the following types of events:
- Health monitoring: Includes performance thresholds, service alerts, hardware alerts, and daily performance summaries.
- High availability monitoring: Includes failover alerts, connection alerts, no partner alerts, and off state alerts.
- High availability mirror change: Includes suspend and resume activities on SQL mirroring.
- Backup monitoring: Includes backup success and failure alerts and restore success alerts.
- General: Includes Windows Defender alerts, RDP change of state notifications, license evaluation expiry reminders, SUPI successful and failed installs, scheduled reboot reminders and errors, and successful and failed user logon attempts.
In the event of a large number of successful or failed logon events, not all events send notifications. However, all System Security events can be found from the Appliance Logs page, listed as Windows System Security Event Log items in the grid.
To configure email notifications:
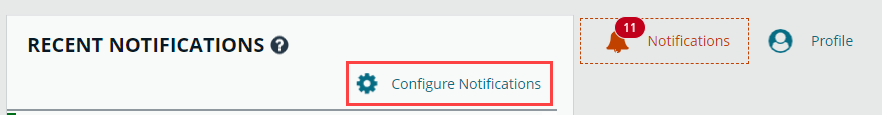
- At the top right of the console, click Notifications, and then click Configure Notifications.
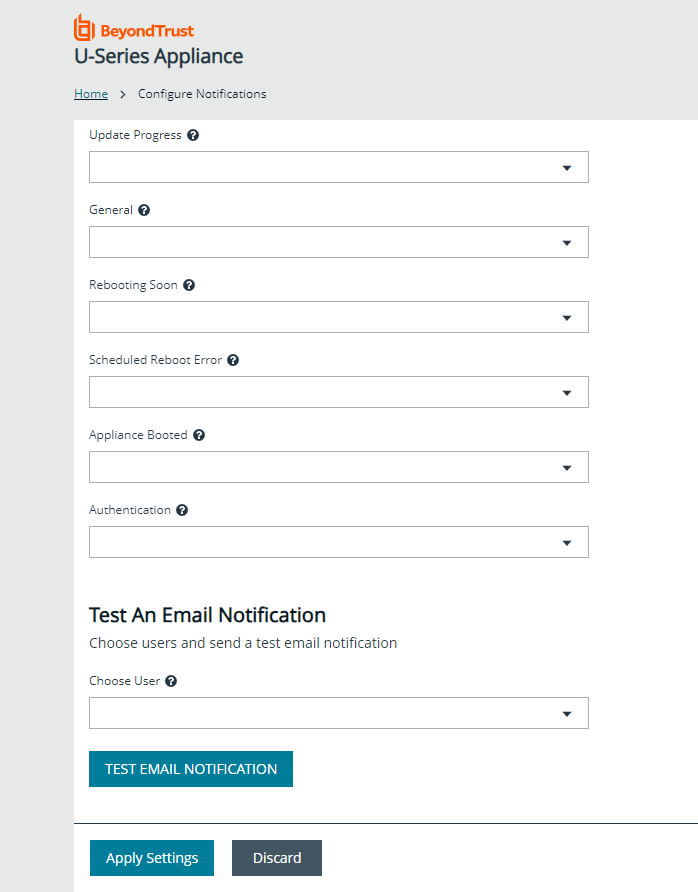
- For each event type, click the dropdown list to select the users who you want to receive notifications.
- Click Apply Settings.
- To Test an Email Notification, select one or more users from the dropdown list, and then click Test Email Notification.
Set Up Health Event Forwarding
You can send alerts from the U-Series Appliance to your BeyondInsight management console for further analysis.
Health events are about the hardware or software services that are generated by your appliance. If you require these events to be integrated with third-party monitoring products, you can forward these events to BeyondInsight.
BeyondInsight has a wide variety of third-party connectors that allow you to integrate your monitoring needs (for example, SNMP, SIEM tools, Microsoft Operations Manager, etc.).
In addition to choosing an option on this page, there must be a Syslog Event Forwarder connector configured from the BeyondInsight Management console so that BeyondInsight can import health events.
To set up health event forwarding:
- From the left menu, under Integrations, click Health Event Forwarding.
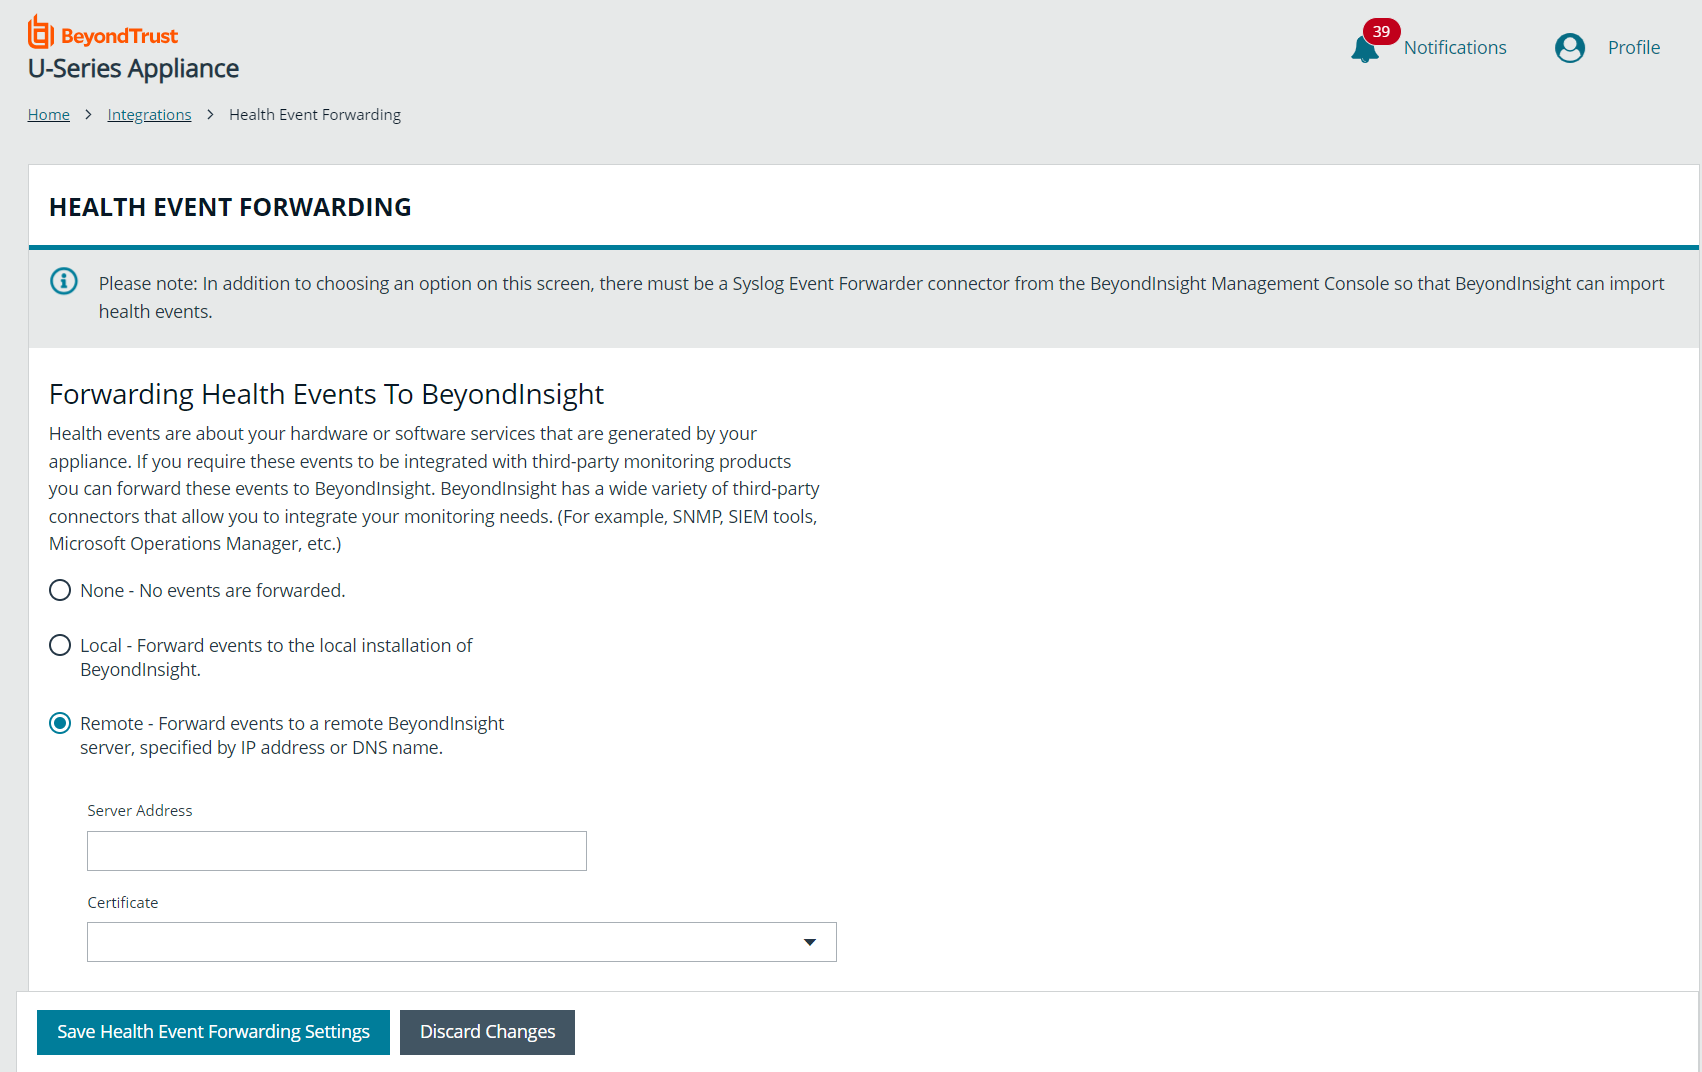
- Select an option:
- None: No events are forwarded.
- Local: Forward events to the local BeyondInsight installation.
- Remote: Forward events to a remote BeyondInsight server, specified by IP Address or DNS Name.
- If using the Remote option, two additional fields appear. You must export a certificate from the remote server and import the certificate to the local U-Series Appliance.
- If the remote server is another U-Series Appliance, log in to that U-Series Appliance's website.
- From the left menu, under Security and Compliance, click Certificate Management.
- Under Export Certificate, enter a password and confirm it, and then click Export and Download Certificate.
- Import the certificate on the local U-Series Appliance, as follows:
- From the left menu, under Security and Compliance, click Certificate Management.
- Upload the certificate by dragging the file into the drag and drop box, and entering the password created in the previous step.
- Return to the Health Event Forwarding page. Under the Remote option, enter a Server Address, and select a Certificate from the list.
- If the remote server is a software install of BeyondInsight, use the BeyondInsight Configuration Tool to create and export the certificate.
- Click Save Health Event Forwarding Settings.
You must also create a connector from the BeyondInsight management console, as follows:
- Log in to BeyondInsight.
- Navigate to Configuration > General > Connectors.
- Click Create New Connector +.
- Enter a Connector Name.
- Select Syslog Event Forwarder from the Connector Type dropdown.
- Click Create Connector.
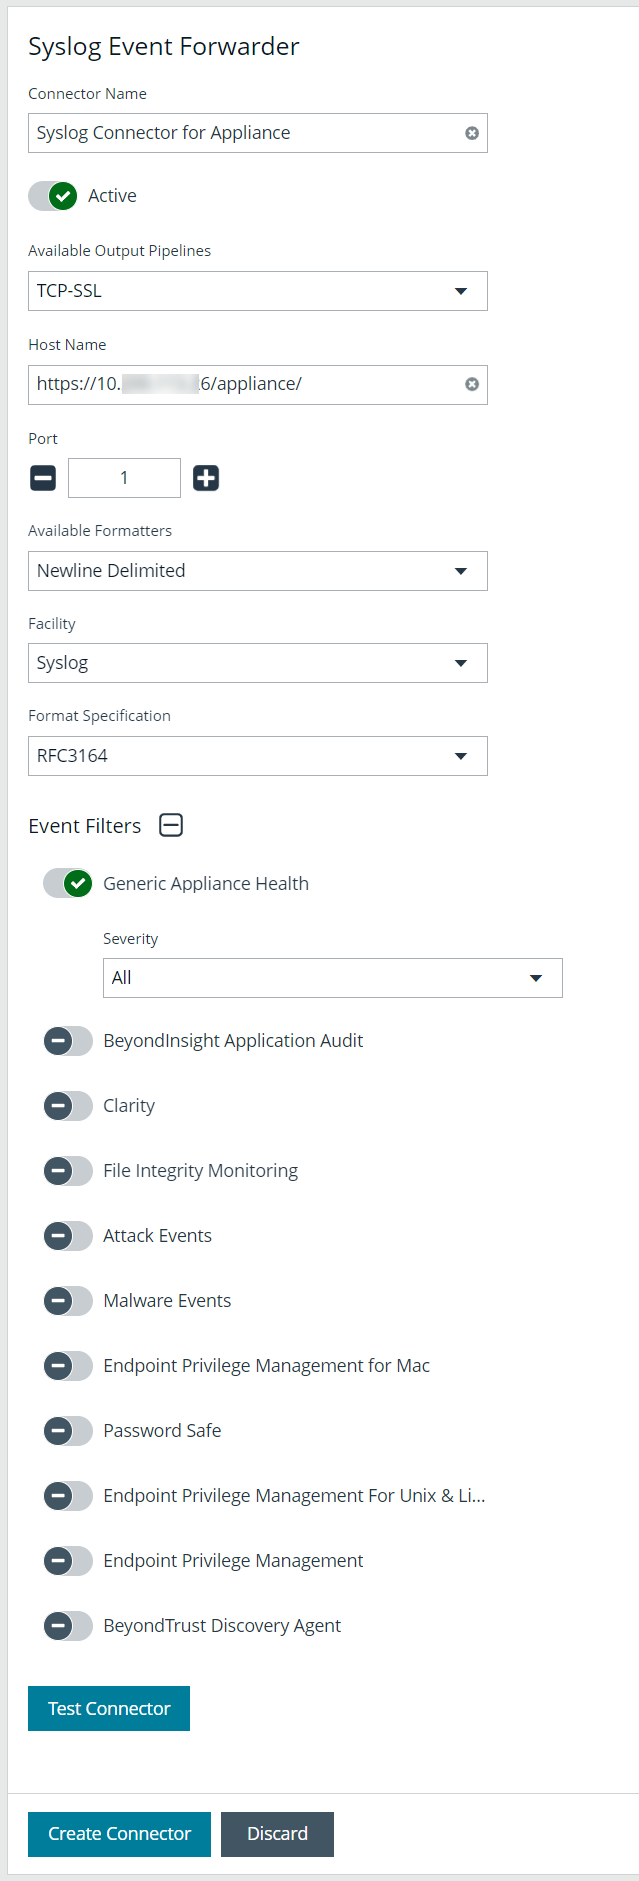
- Enter the details for the U-Series Appliance, including IP address, protocol, and facility.
- Expand the Event Filters section.
- Toggle the General Appliance Health filter to enable it.
- By default, all severity levels are included. You may select an alternate level if needed.
- Click Create Connector.
For more information on importing a certificate to the U-Series Appliance, please see Upload SSL Certificate.
View Notifications
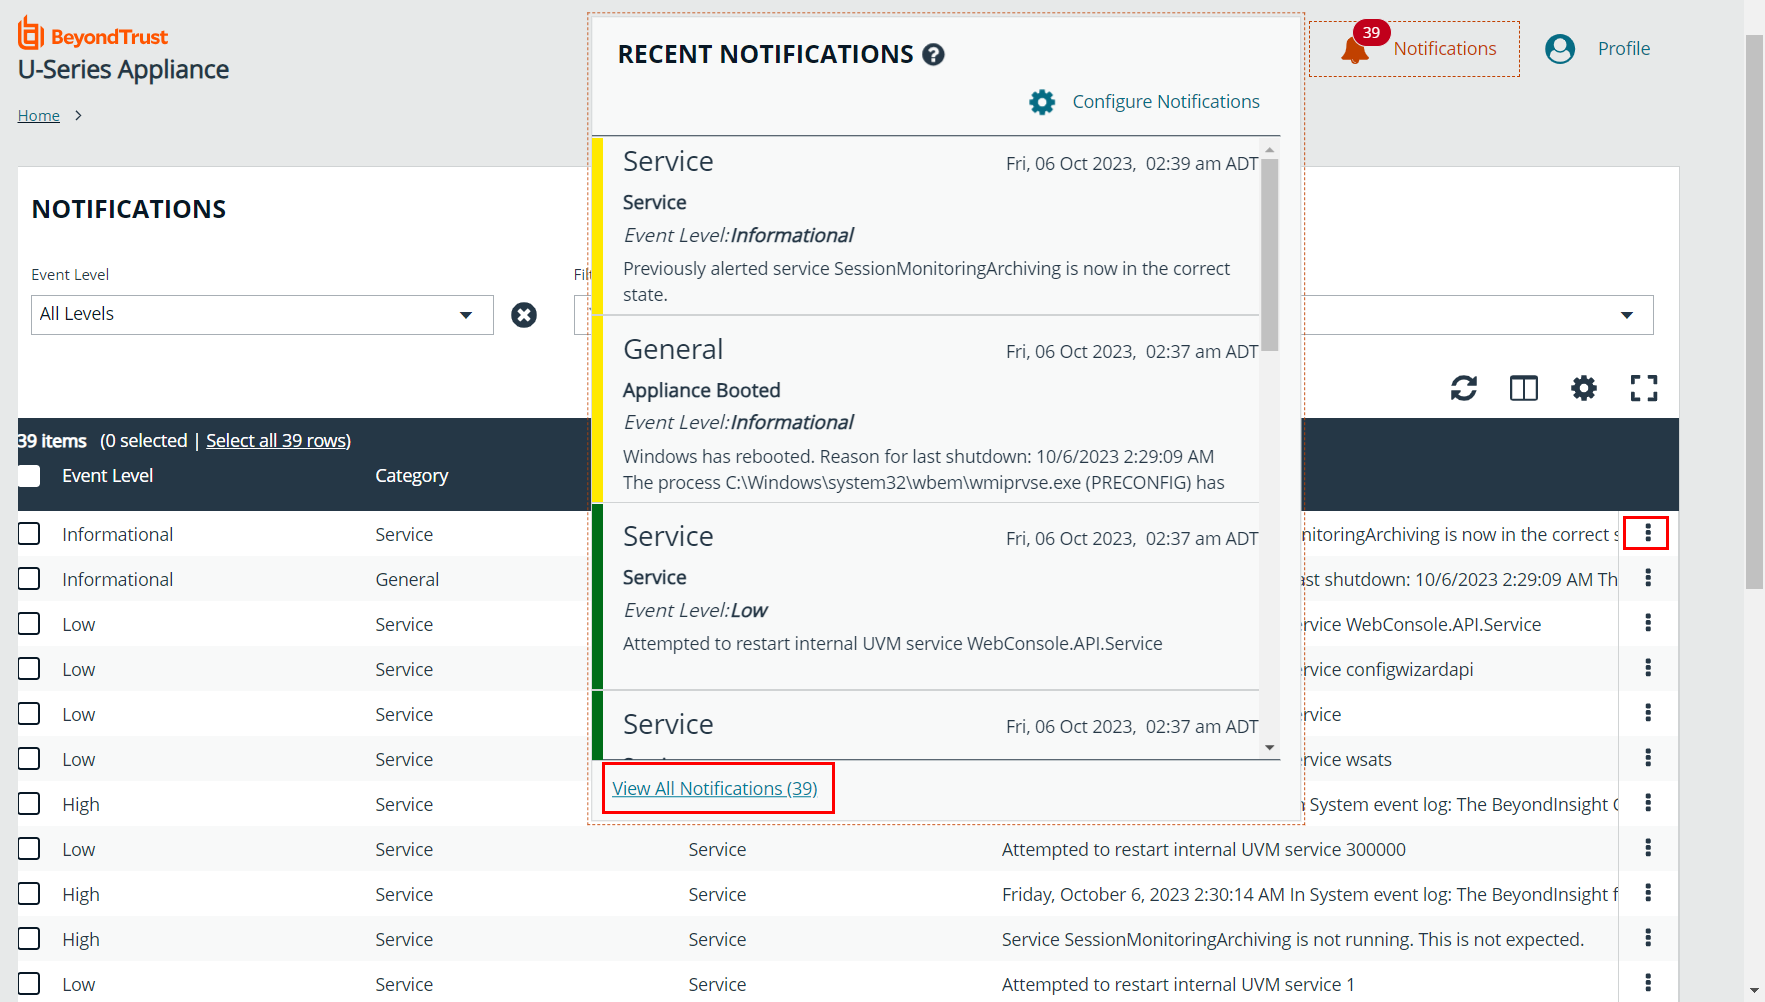
After notifications are received, a red number indicates the number of notifications. Click Notifications to view the 10 most recent notifications.
The red notification number indicates the number of notifications in total, and not the number of unread notifications.
The bar next to the notification indicates severity.
Color Legend

|
Info |

|
Low |

|
Medium |

|
High |
Click the View All Notifications link at the bottom of the Recent Notifications window to be taken to the Notifications grid where all notifications are listed.
To view more details about a notification, click the vertical ellipsis for the notification and then select Notification Details.
To delete an individual notification, by click the vertical ellipsis to the right of the notification and then select Delete Notification.
To delete multiple notifications or all notifications, select them in the grid or click Select all x rows at the top of the grid, and then click Delete Notification above the grid.
Diagnose Network Connectivity Issues
You can view network configuration information and use ping to assist with diagnosing network connectivity issues.
- From the left menu, under Network, click Diagnostic Tools.
- To ping a server:
- Select Ping Command.
- Enter the fully qualified domain name, hostname, or IP address in the Server Address field.
- Click Get Results.
- Select Network Configuration to view the results from IPConfig /all.
Download Log Files
Downloading log files is typically done when troubleshooting a recent issue.
Download Individual Log Files
To download individual log files:
- From the left menu, under Features and Services, click Appliance Logs.
- At the right of a log entry, click the Download Log button.
Download All Log Files
The "download all" process includes the last three months of logs.
To download all log files:
- On the sidebar menu, under Features and Services, select Appliance Logs.
- At the top right of the log entries list, click the Download All icon.
Export Log Files
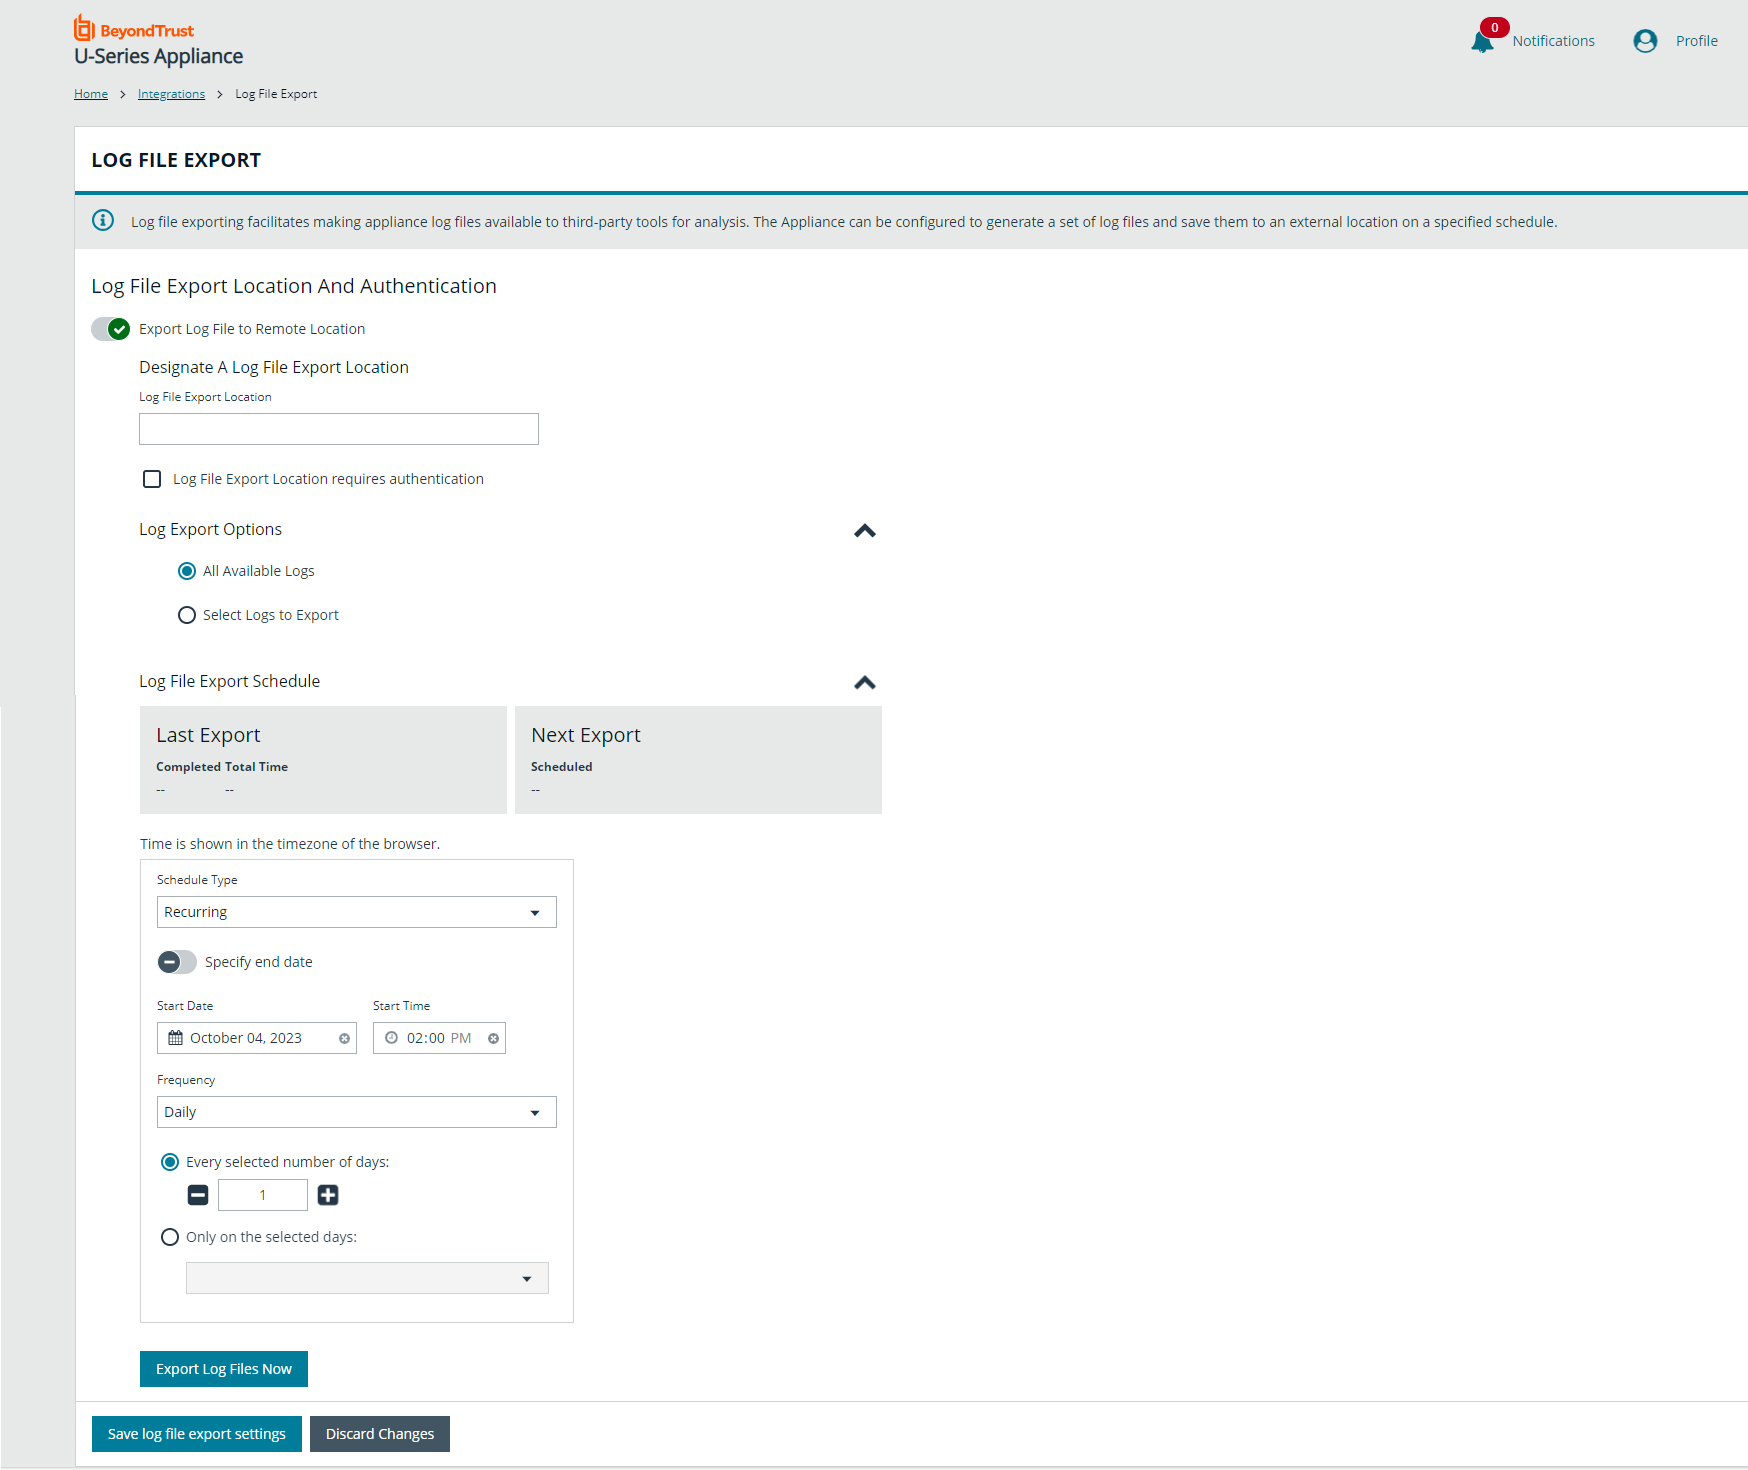
Log file exporting facilitates making appliance log files available to third-party tools for analysis. The U-Series Appliance can be configured to generate a set of log files and save them to an external location, on a specified schedule.
By default, the Export Log File to Remote Location option is on. When it is turned off, none of the setup options are visible.
The file cannot be saved on the U-Series Appliance.
To set up log file export and authentication:
- From the left menu, under Integrations, click Log File Export.
- Toggle the Export Log File to Remote Location switch to enable it.
- Enter a Log File Export Location.
- If the log file export location requires authentication, check the box.
- Enter the Log File Export Location Username.
- (Optional). Enter a Log File Export Location Password.
- (Optional). Enter the Domain.
- To verify the authentication, click Test Credentials.
- Expand the Log Export Options section.
- Click All Available Logs to export everything.
- Click Select Logs to Export to export individually checked logs.
- Expand the Log File Export Schedule section.
- If using the default Recurring option:
- Enter the Start Date and Start Time, and then select the Frequency from the dropdown list.
- If required, toggle the Specify end date option to set an end date and time.
- Select additional options based on the frequency of the export.
- Select Immediate for an immediate export. Click the Export Log Files Now button.
- Select One Time for a single export. Set the Start Date and Start Time.
- Click Save Log File Export Settings.
- If using the default Recurring option:
At any time after the settings are initially configured, you can click Export Log Files Now to save the log file to the share.