Analyze Events on the Dashboard
After you configure and customize the view on the dashboard, you can quickly view the results to determine if assets are out of compliance.
To view the number of events:
- Log into the BeyondTrust Management Console.
- Expand the Operations Dashboard node, and then expand the Domain node or Subnets node.
- Select the domain that you want to see the events for. The following example shows Event Sources and Selected Metrics.
- Event Sources: Displays the number of events that have been tracked and displays the domain name where the events occurred.
- Selected Metrics: Displays the total number of events collected and the selected collection period. You can select the time frame from the Operational Status list to analyze trends over the time period.
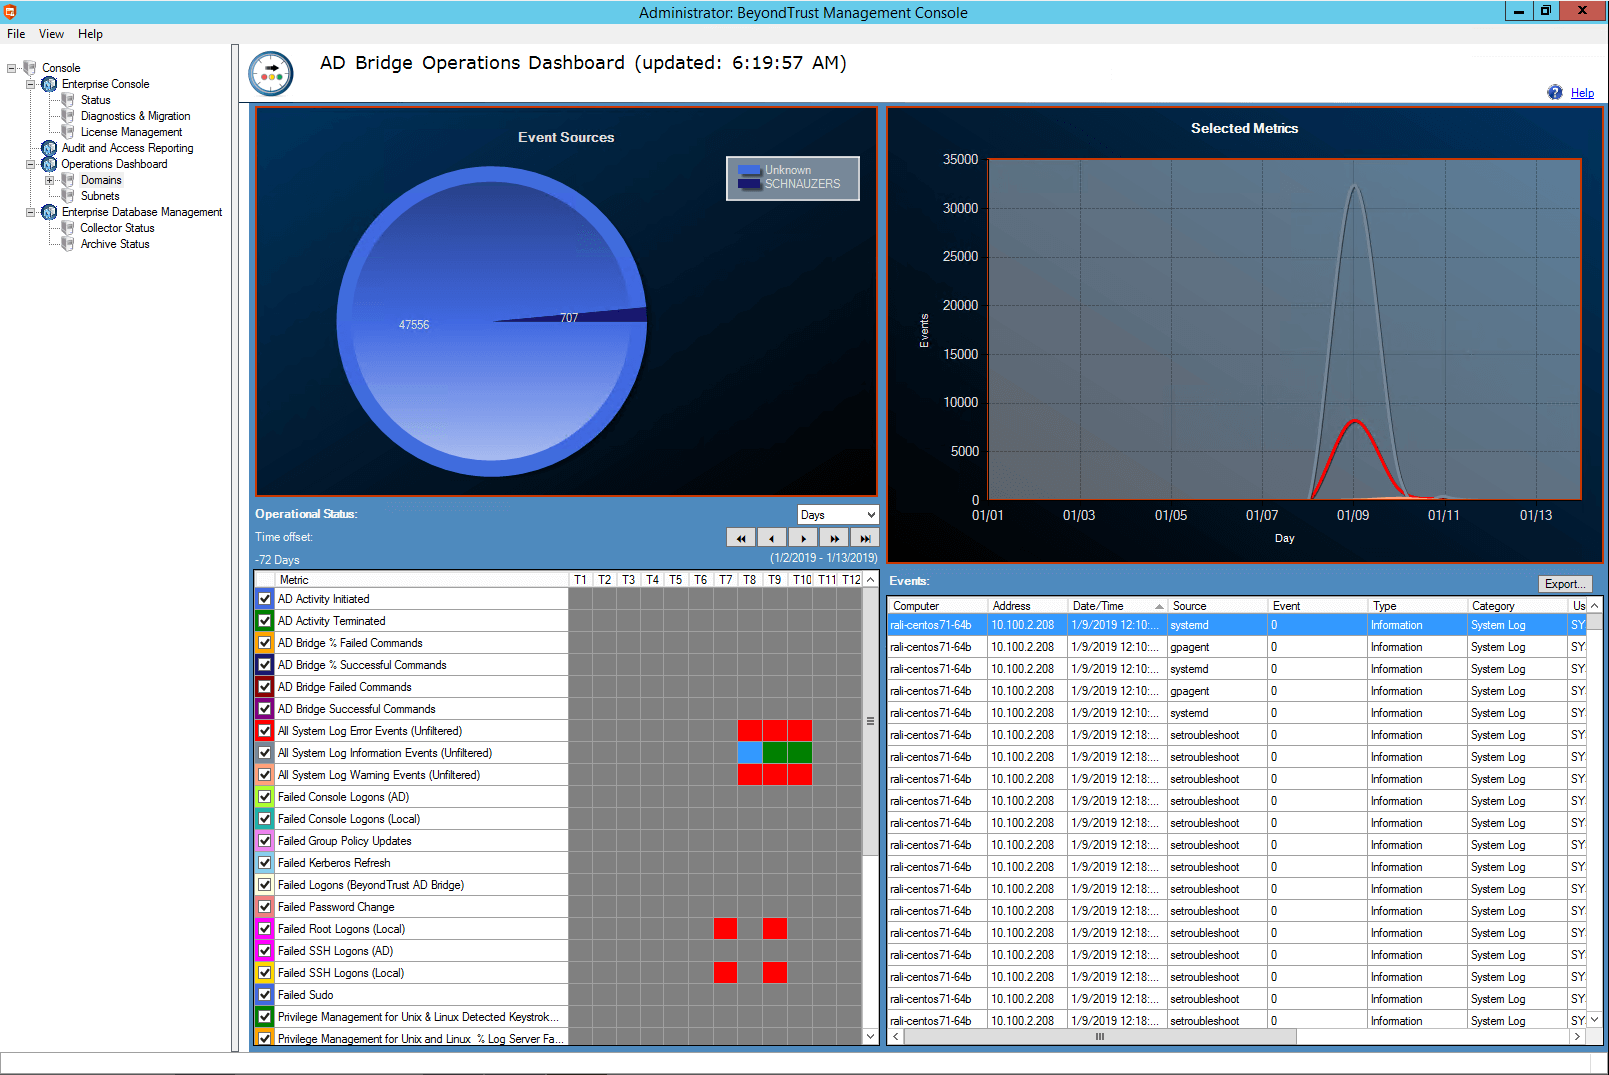
In the metrics pane, you can view the assets where the events occurred. For example, in the following, select a green rectangle (that represents a period in time), which will display the computers in the right pane where the activity occurred.